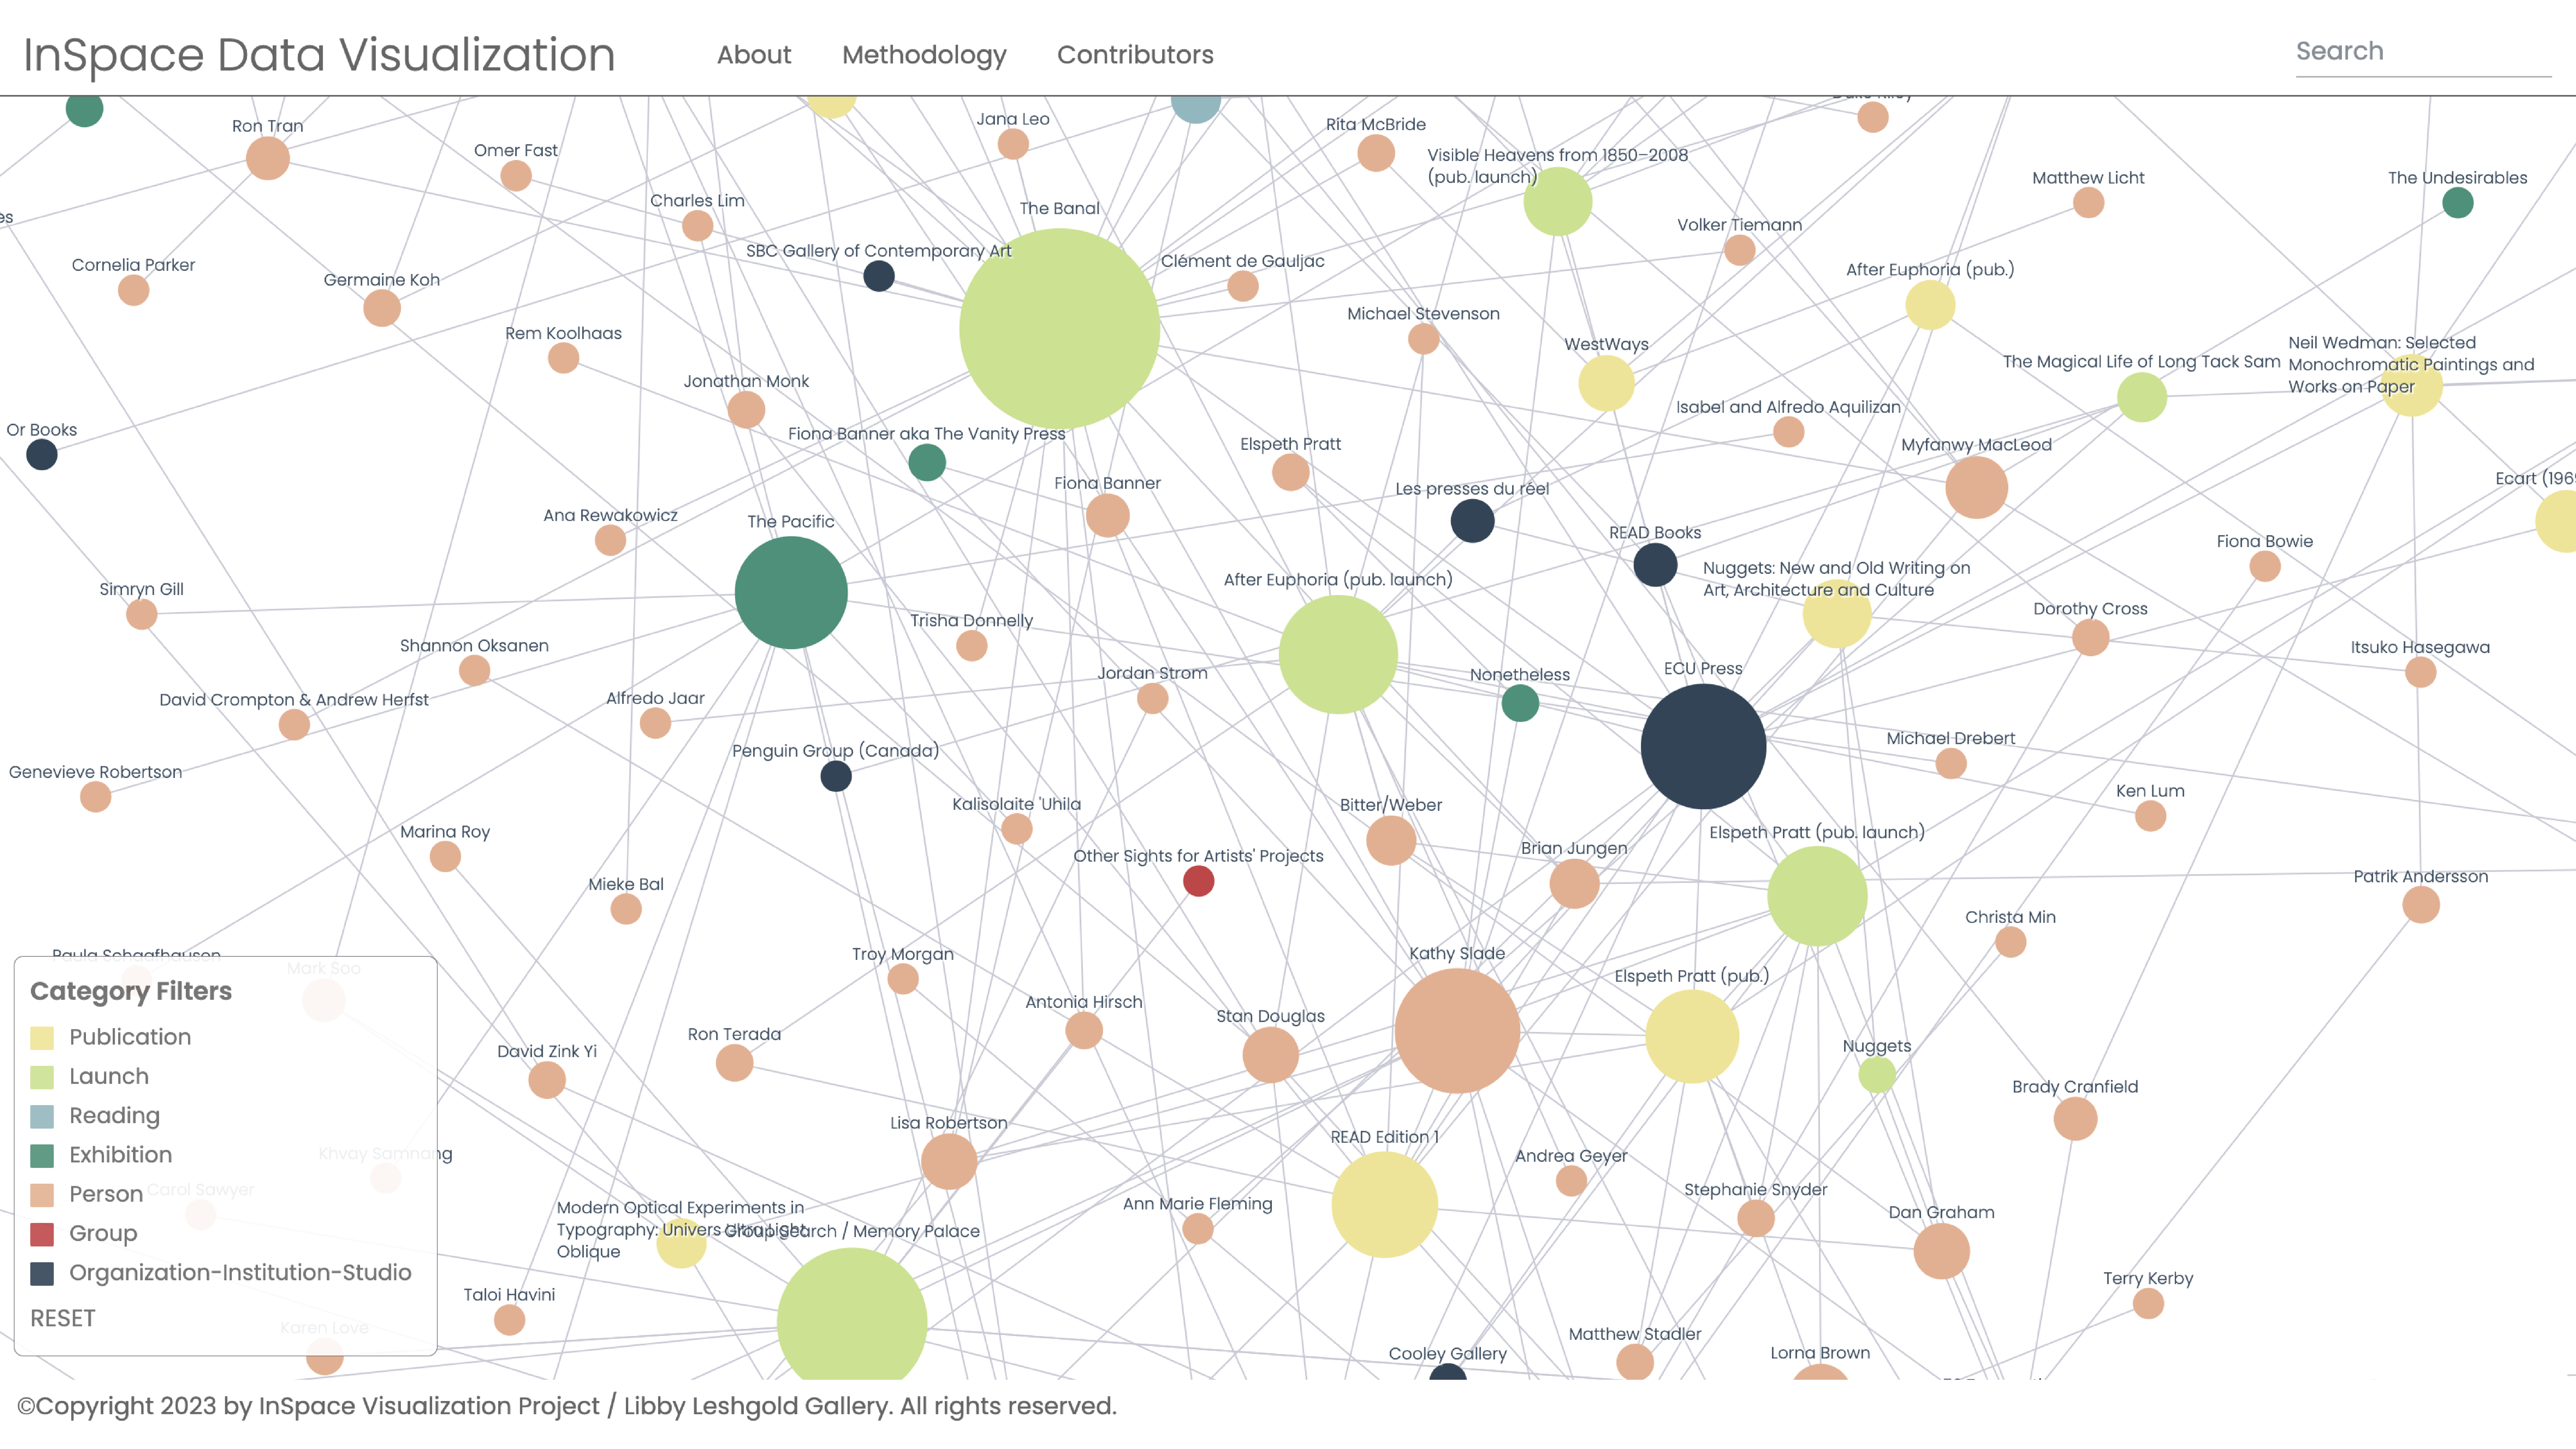
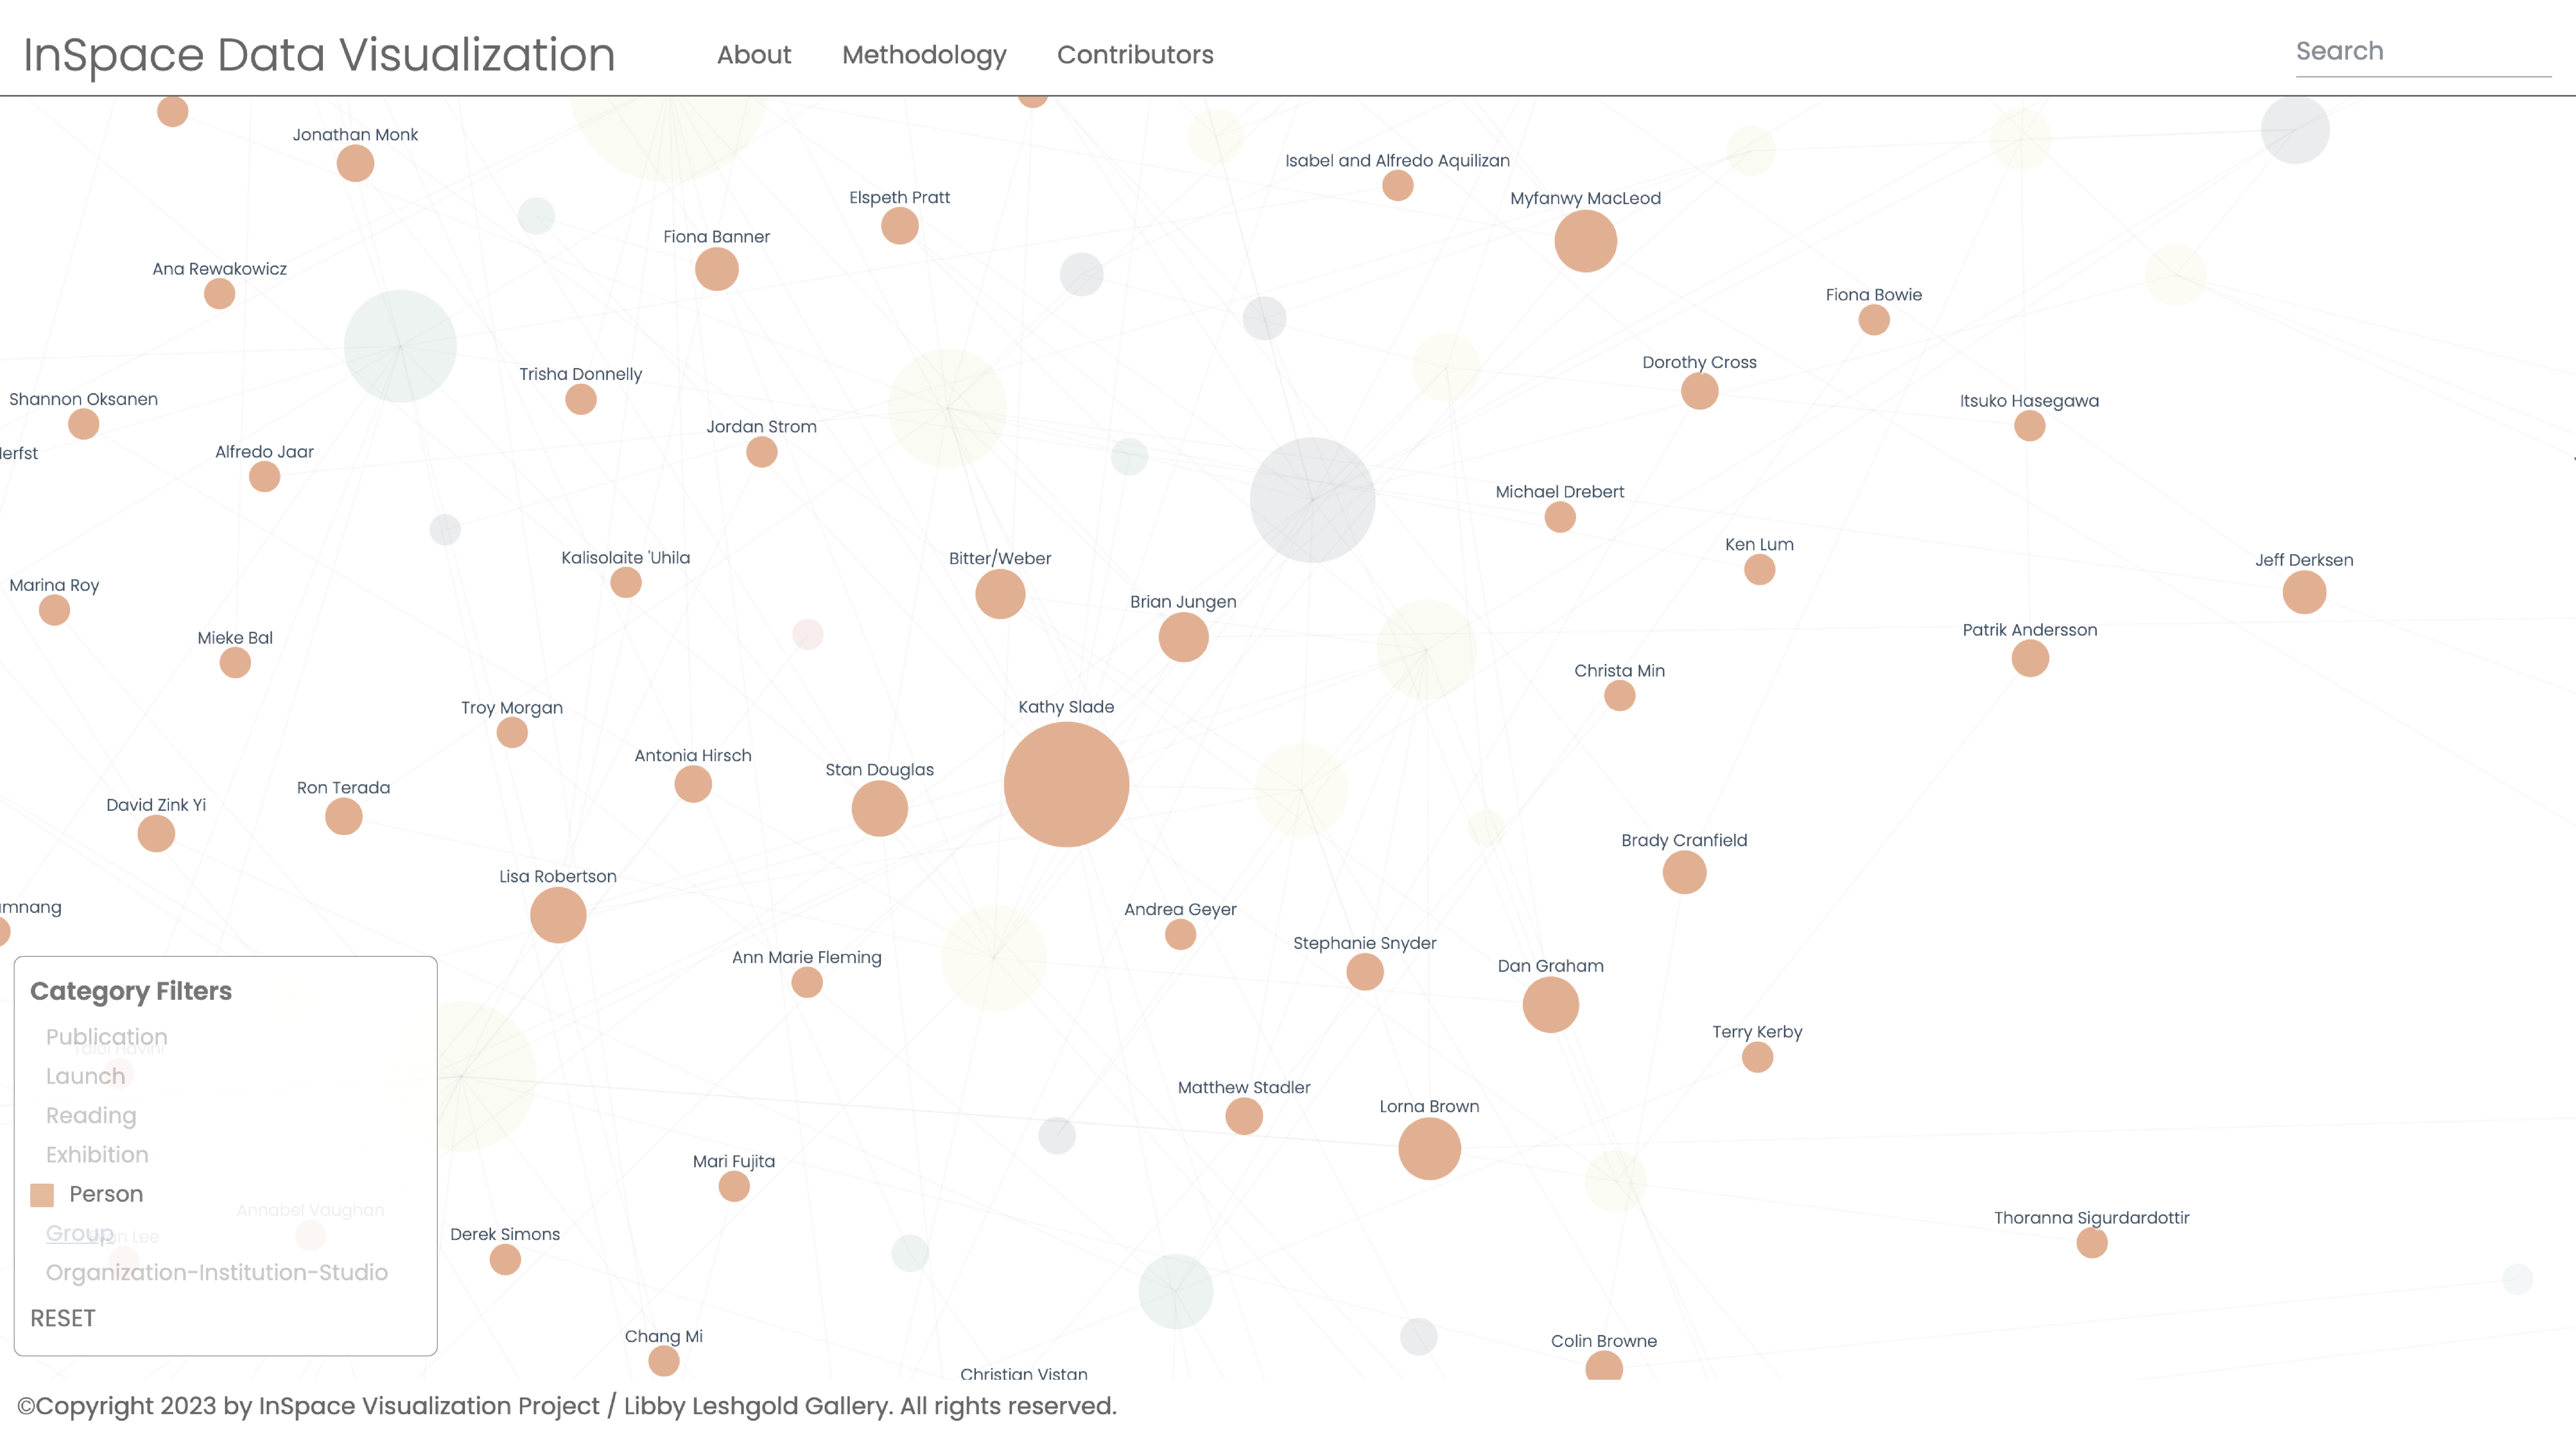
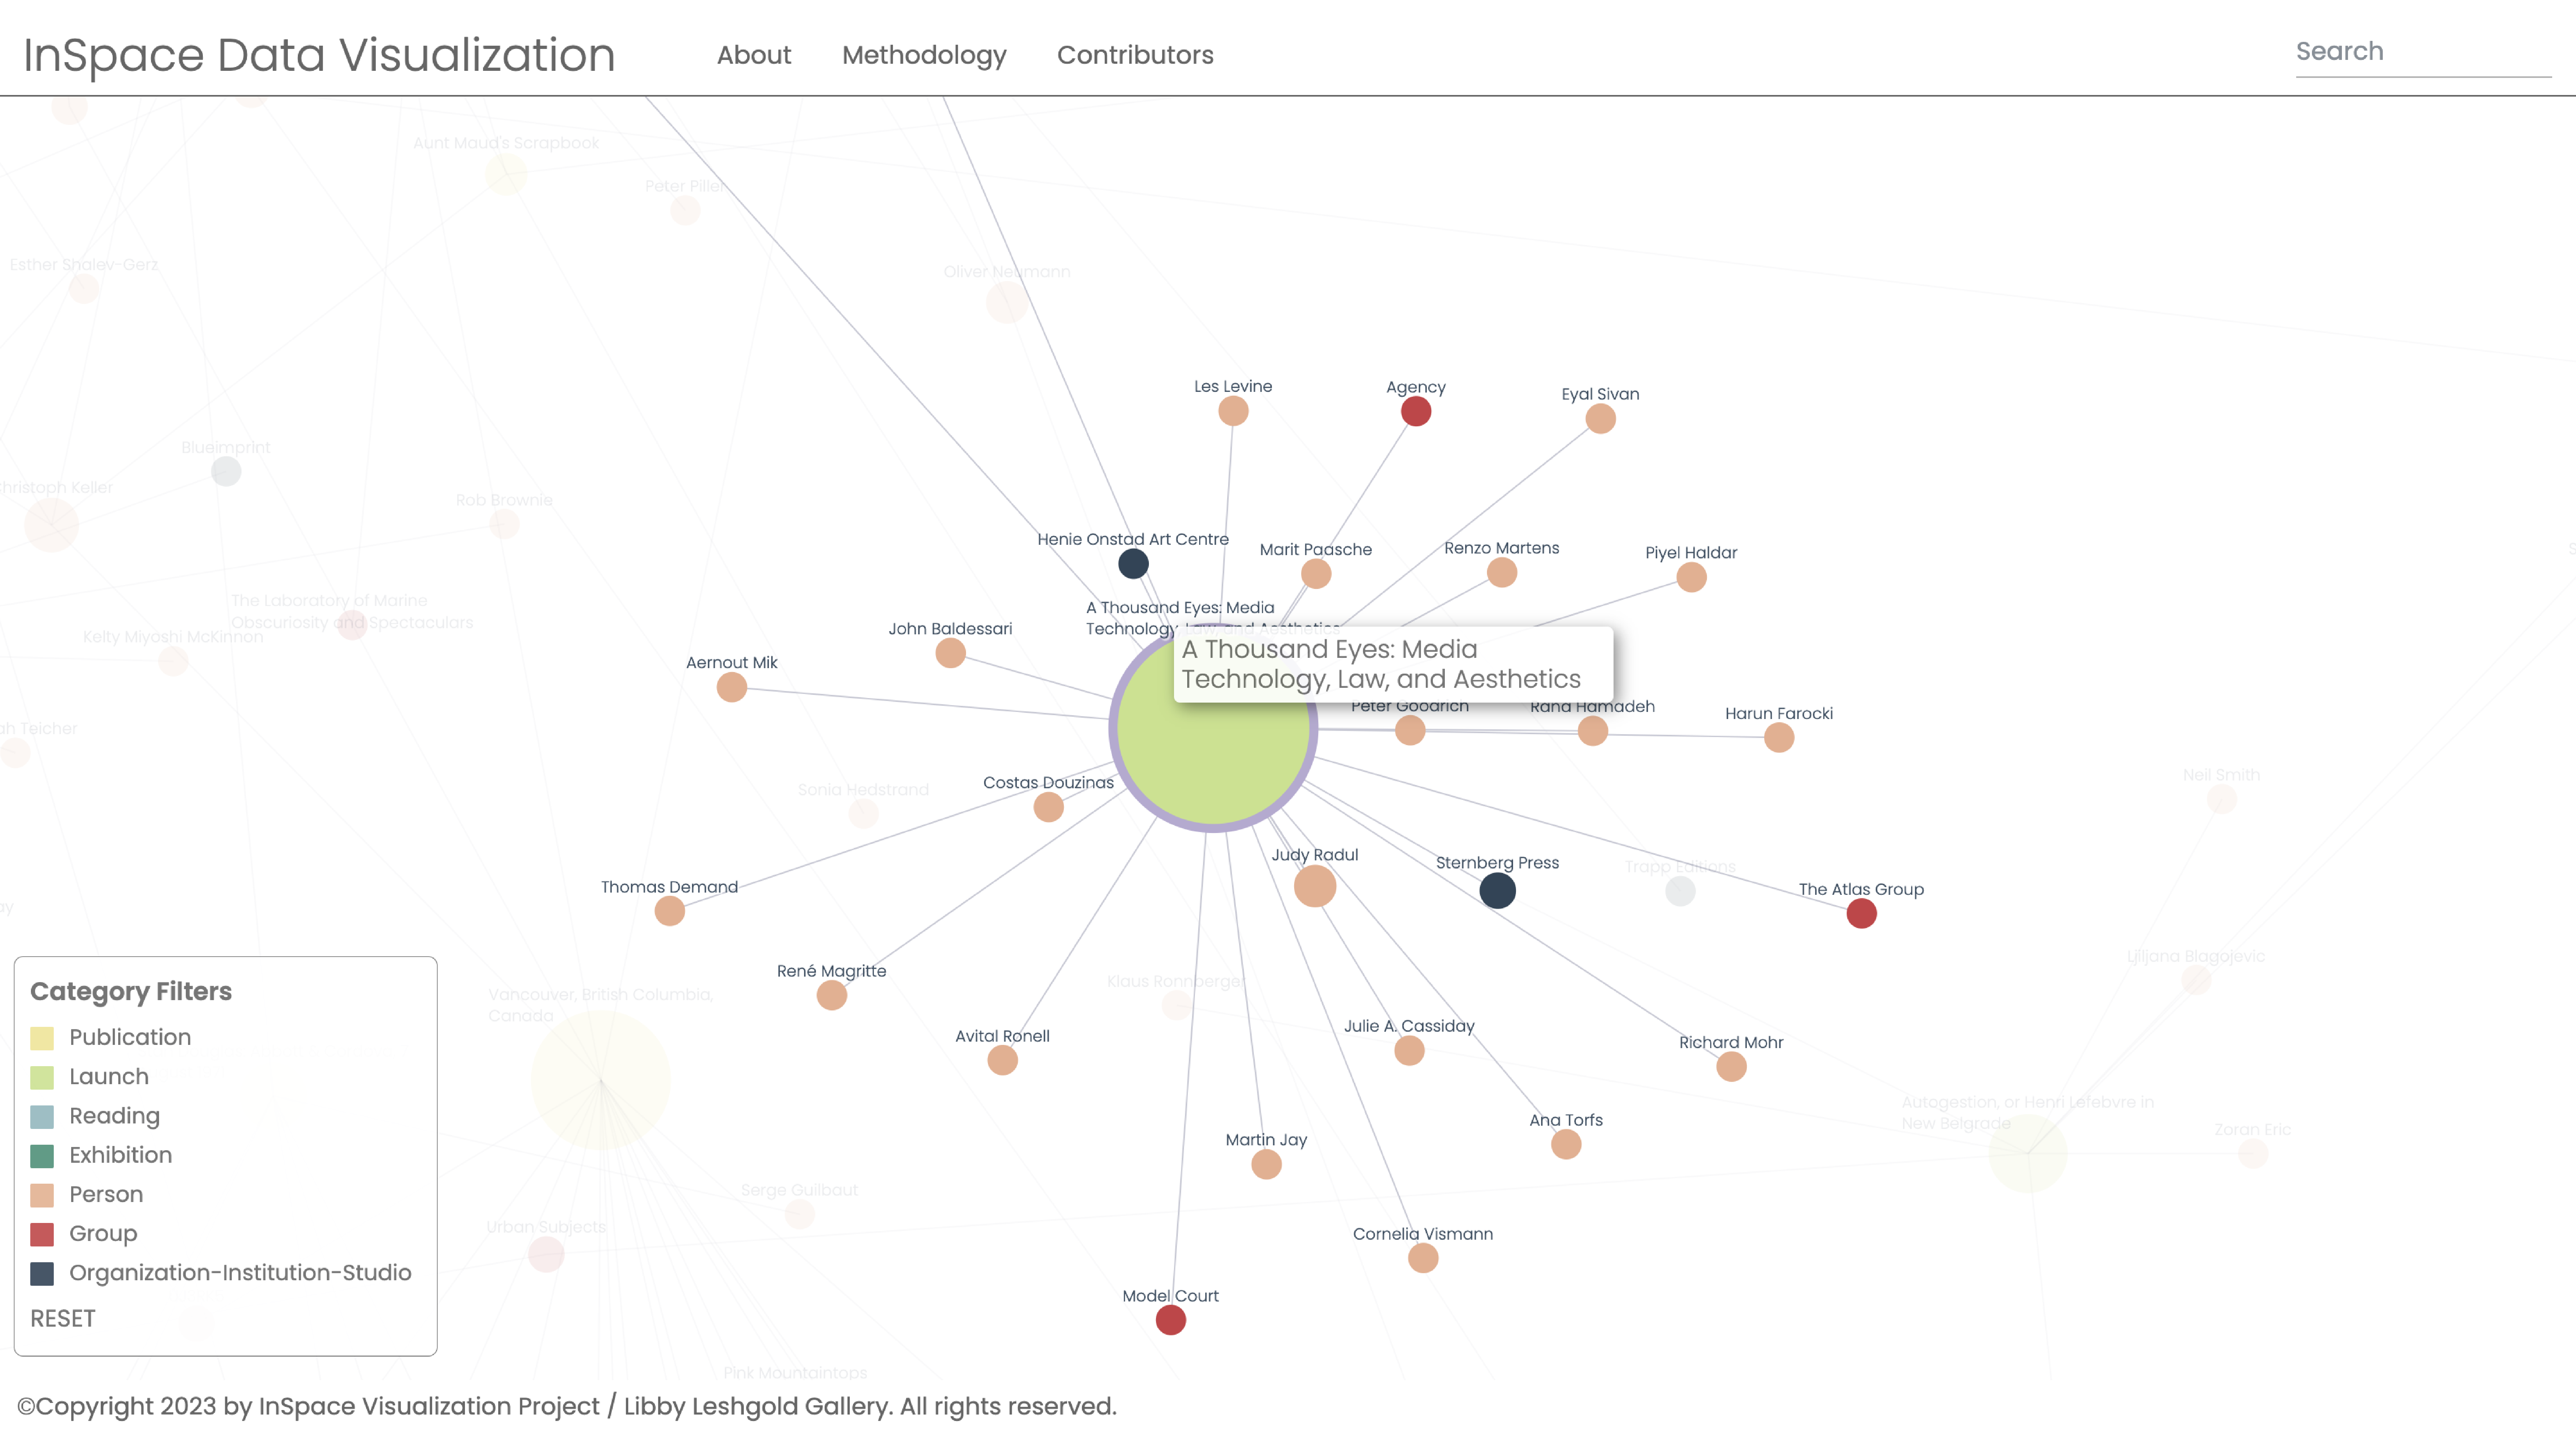
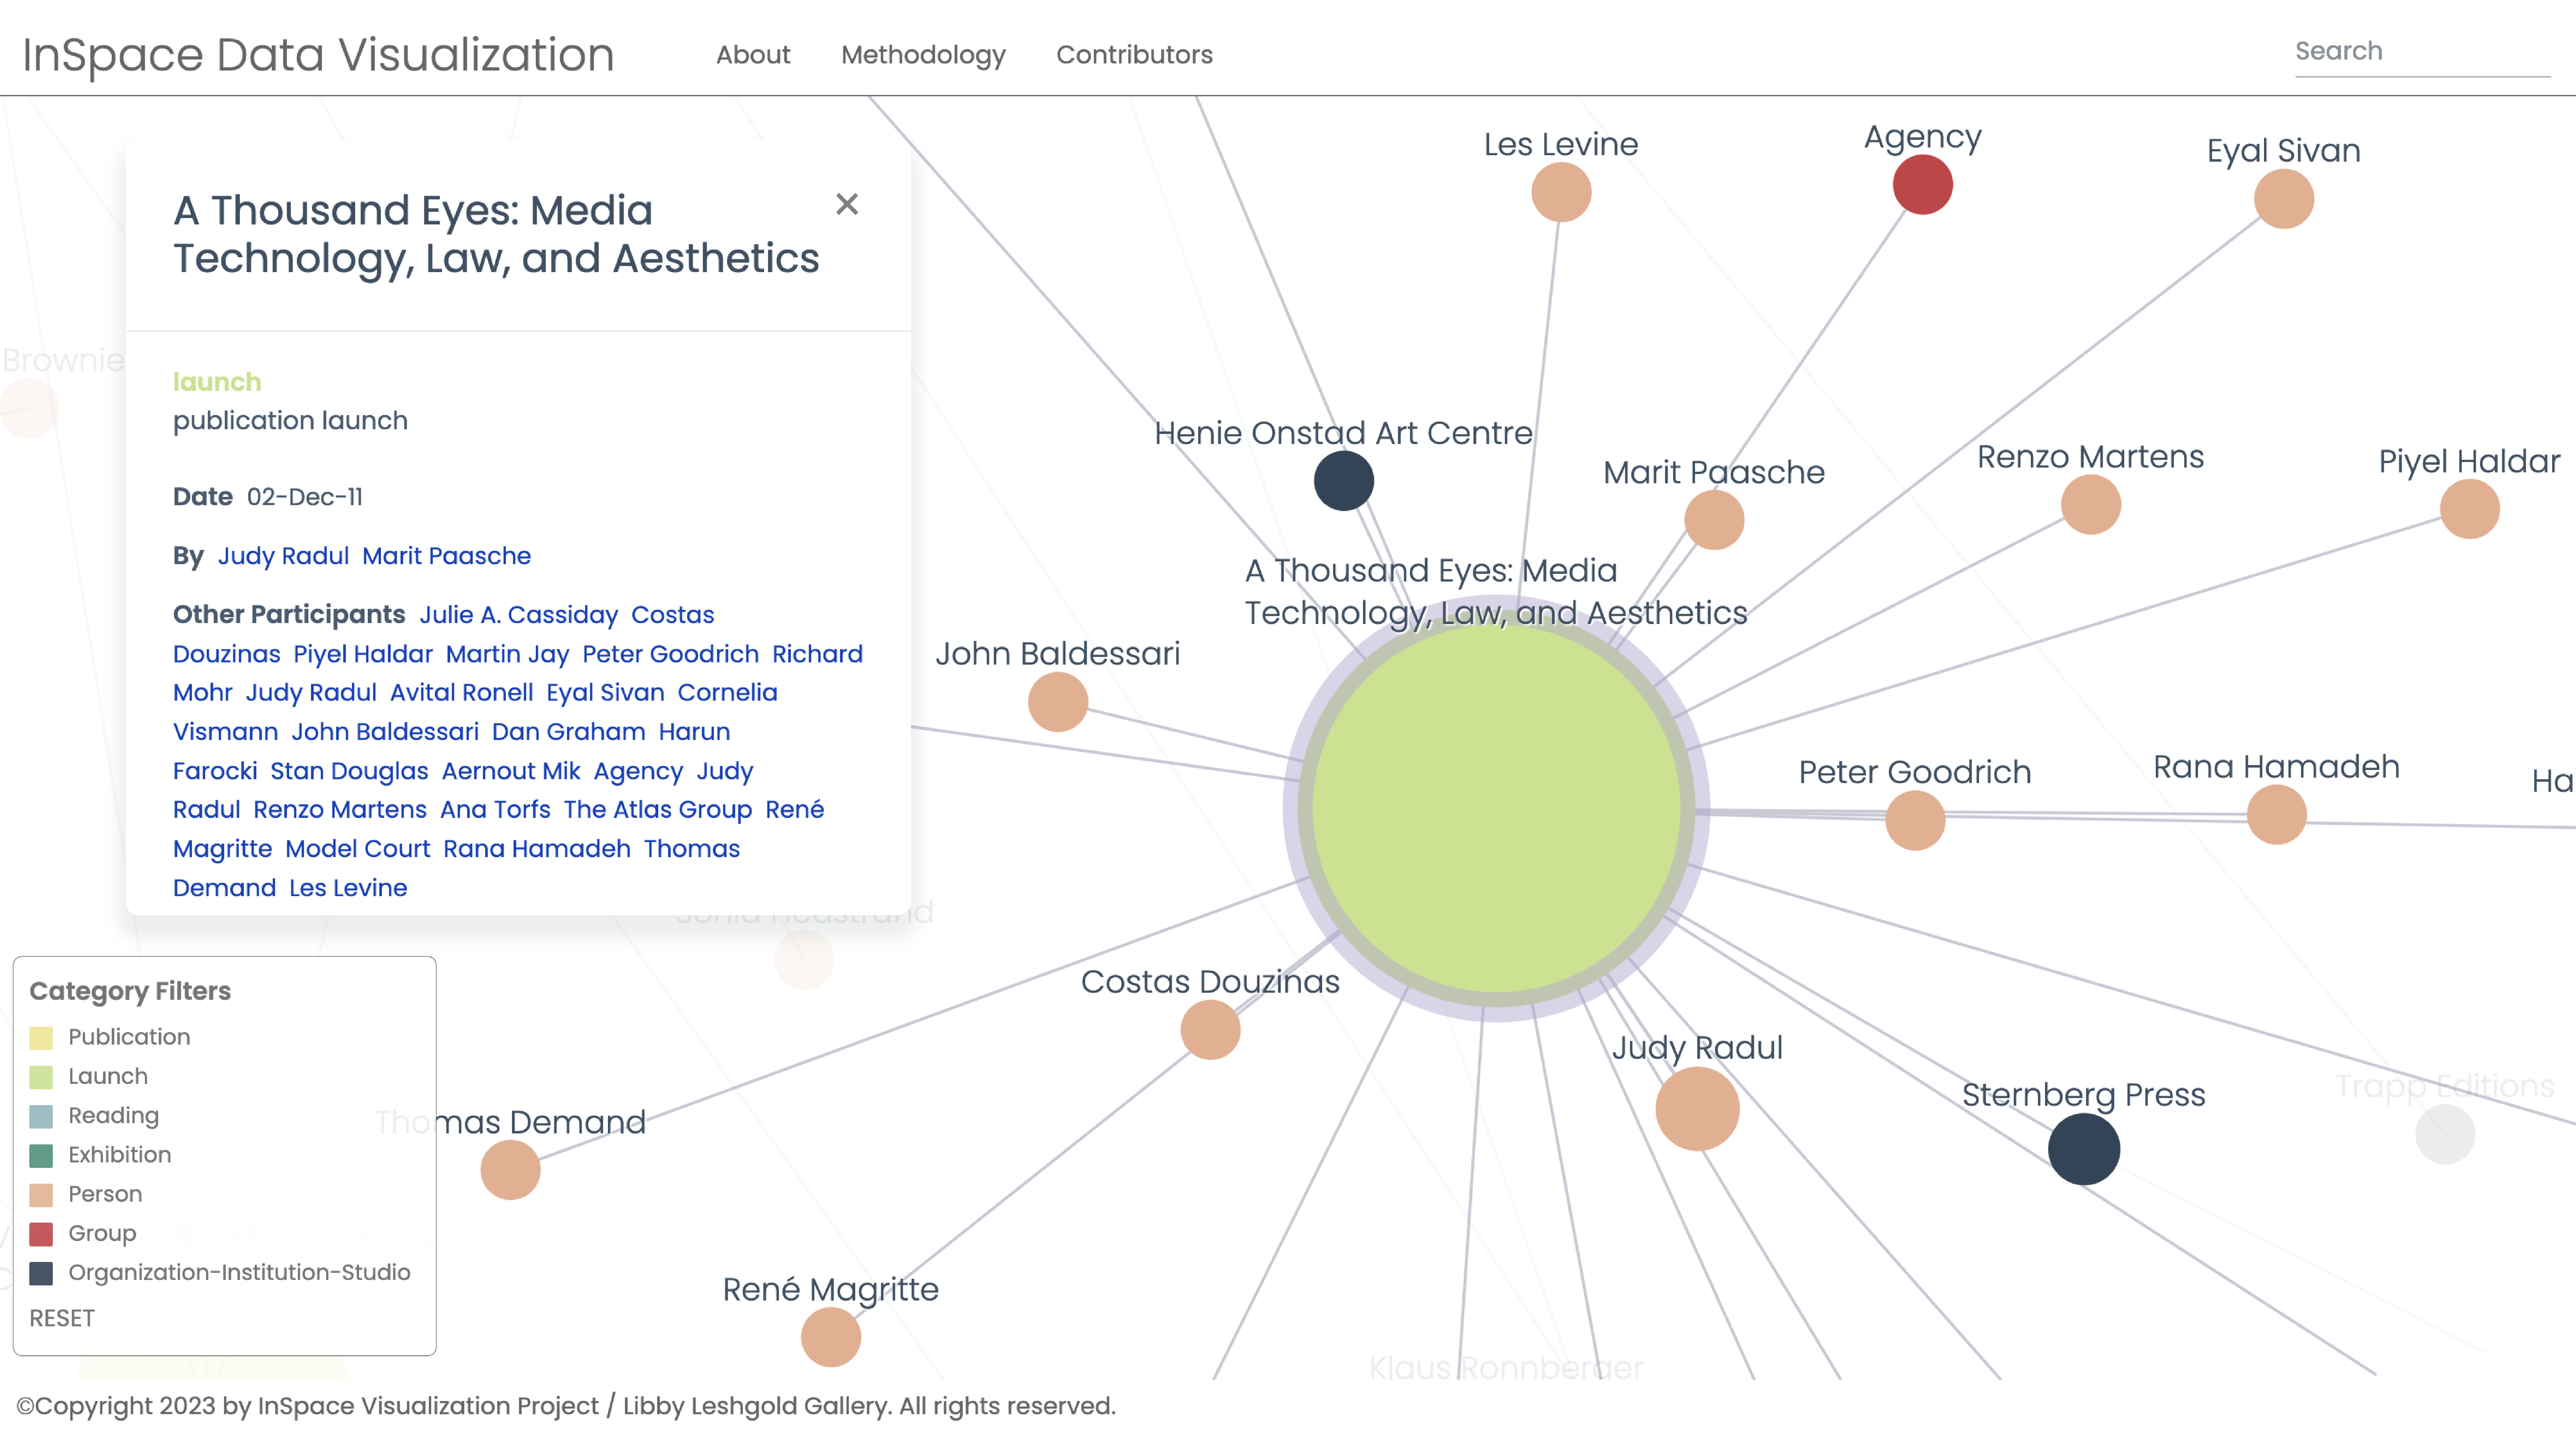
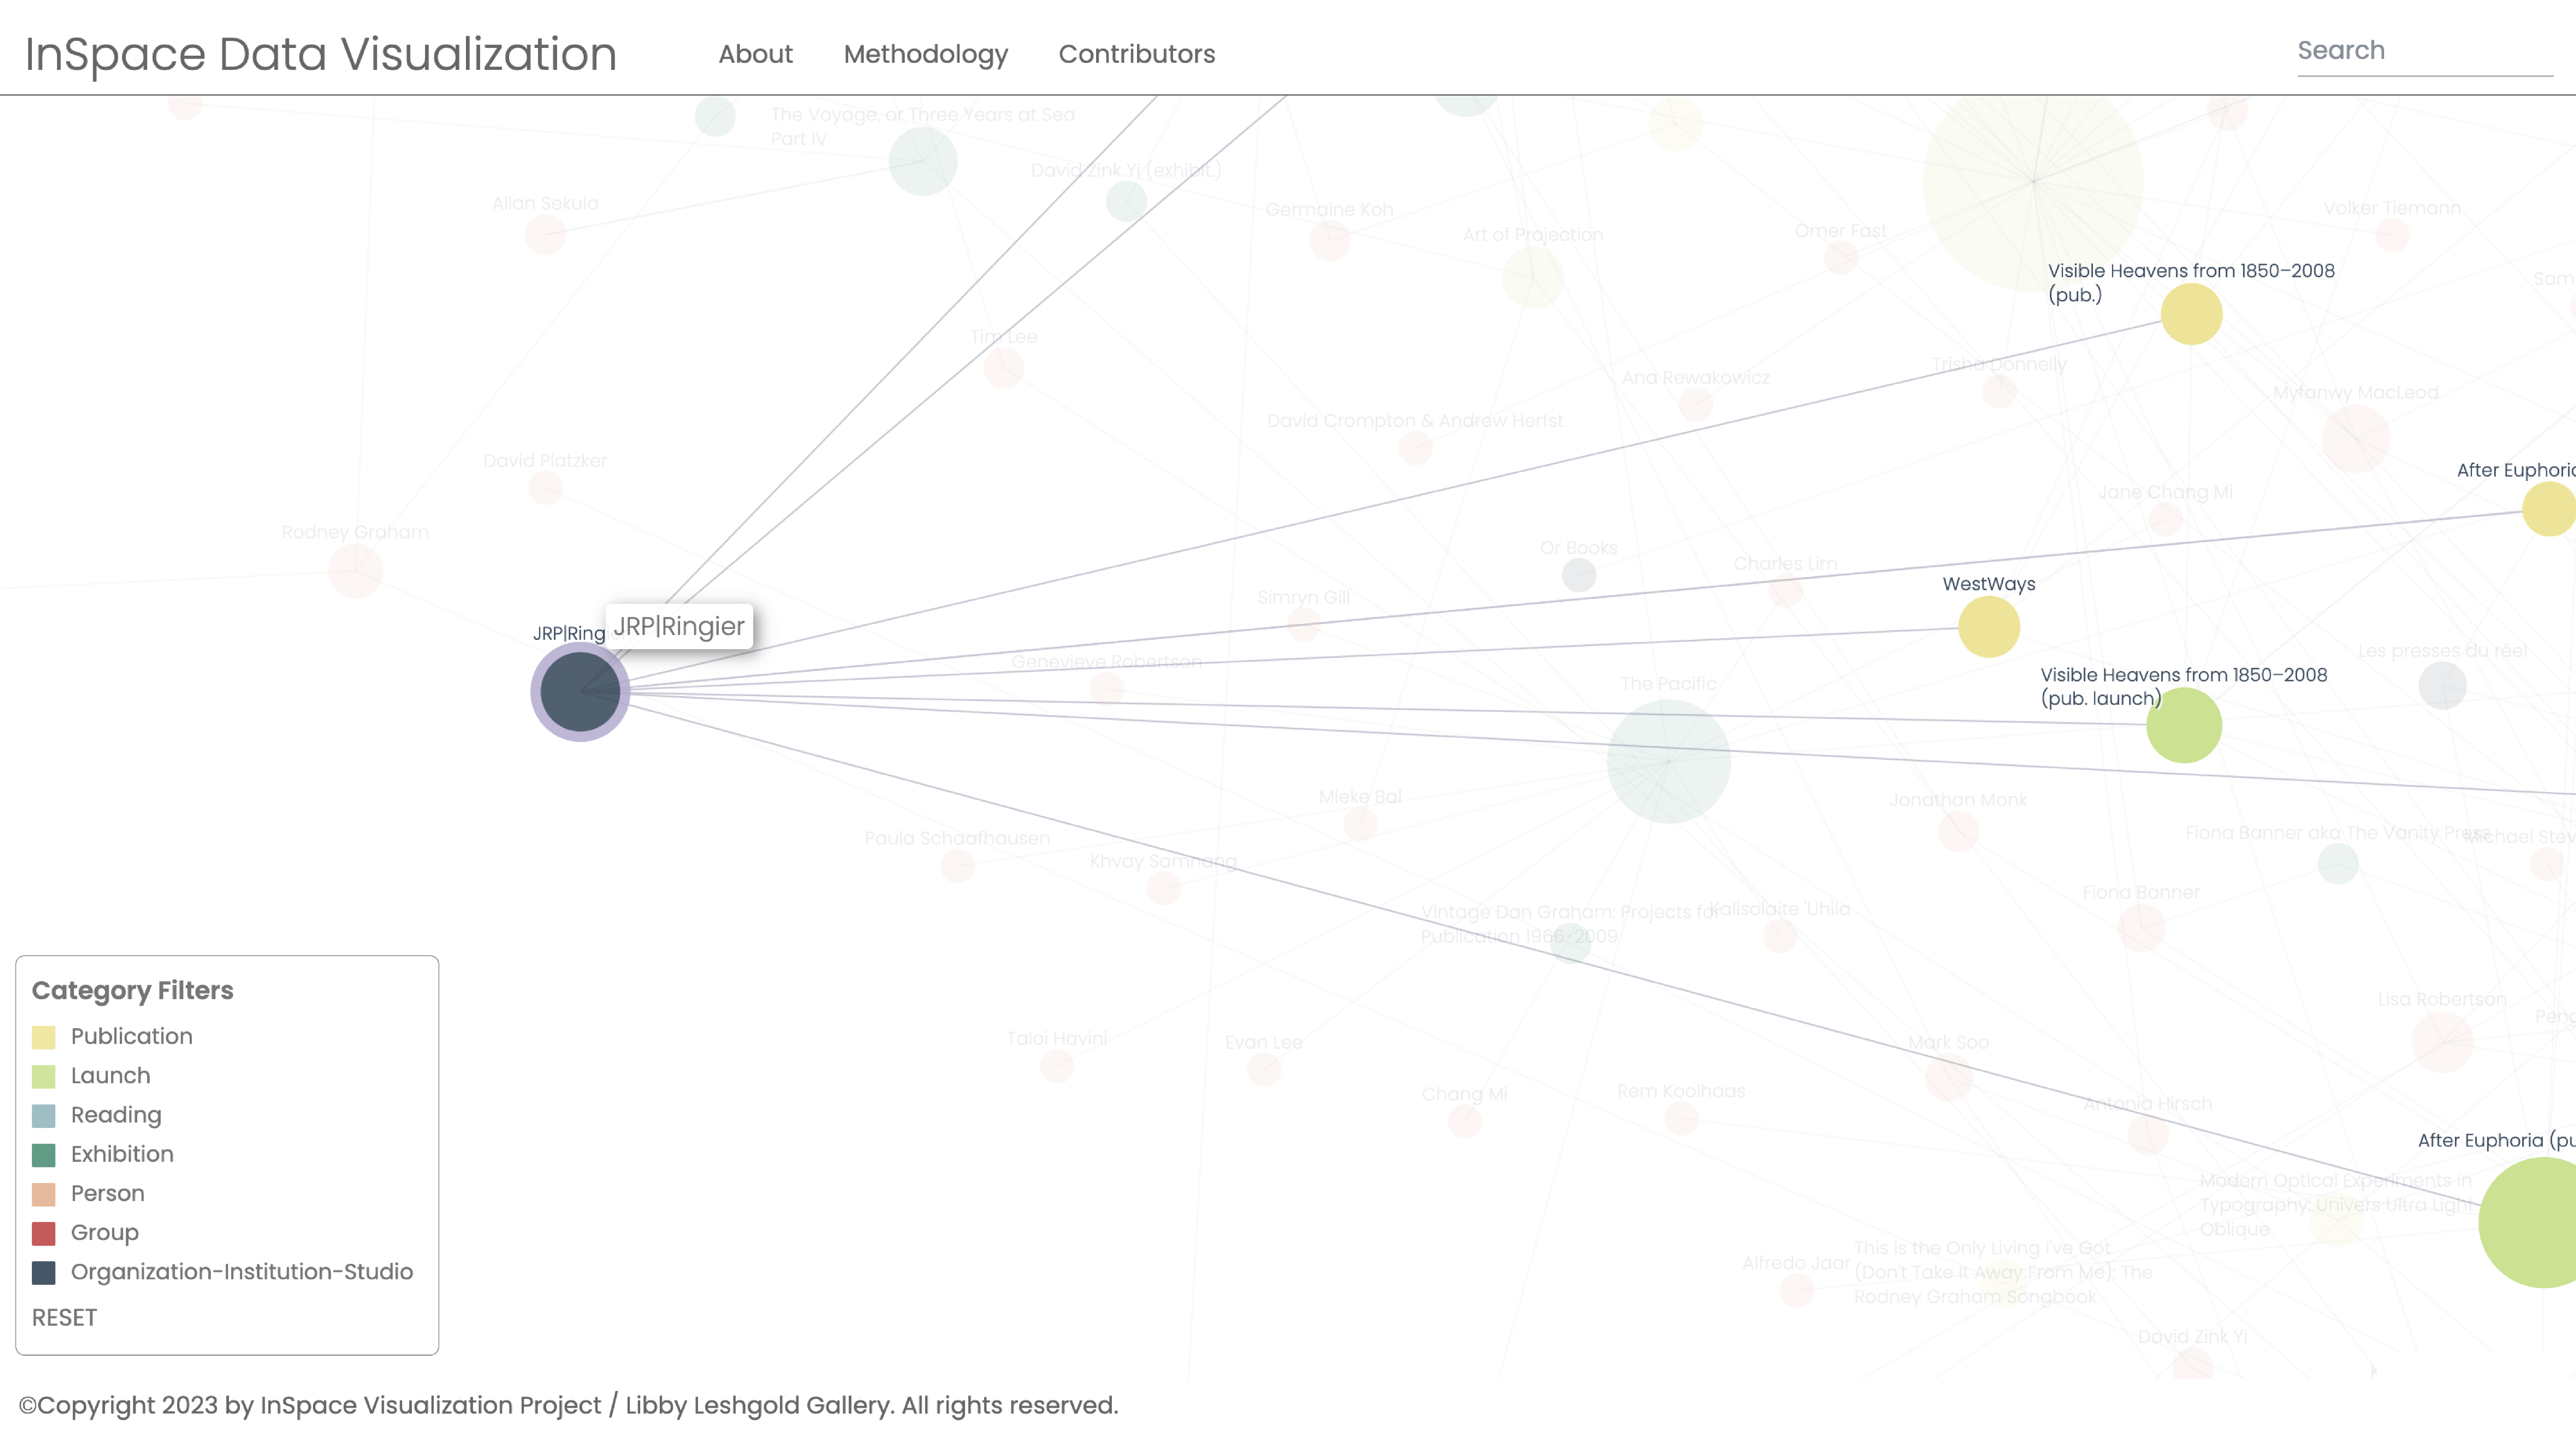
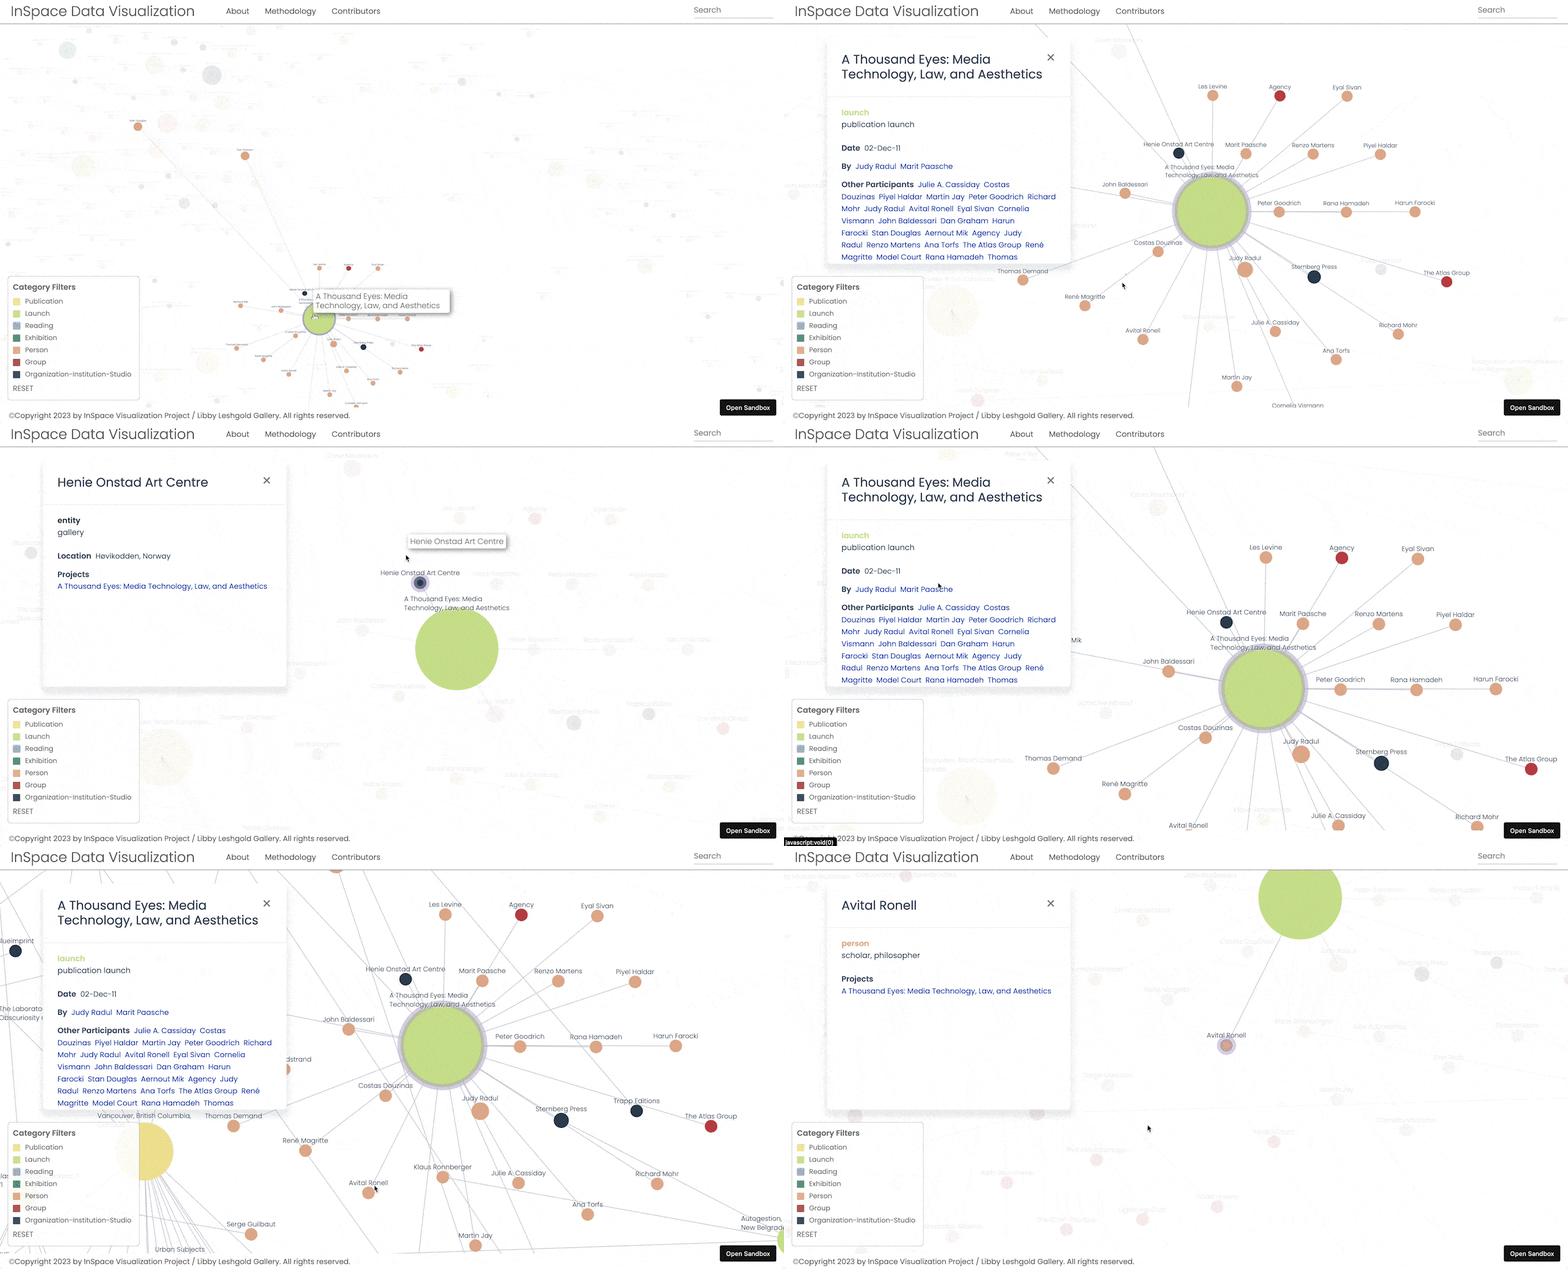
Interactive data visualization built using the d3 library (JavaScript) for Libby Leshgold Gallery (Vancouver).
Work included data modelling, cleaning, web design, and development. The visualization will be hosted in fall 2025.
Work included data modelling, cleaning, web design, and development. The visualization will be hosted in fall 2025.
Project type:
information design
information design
