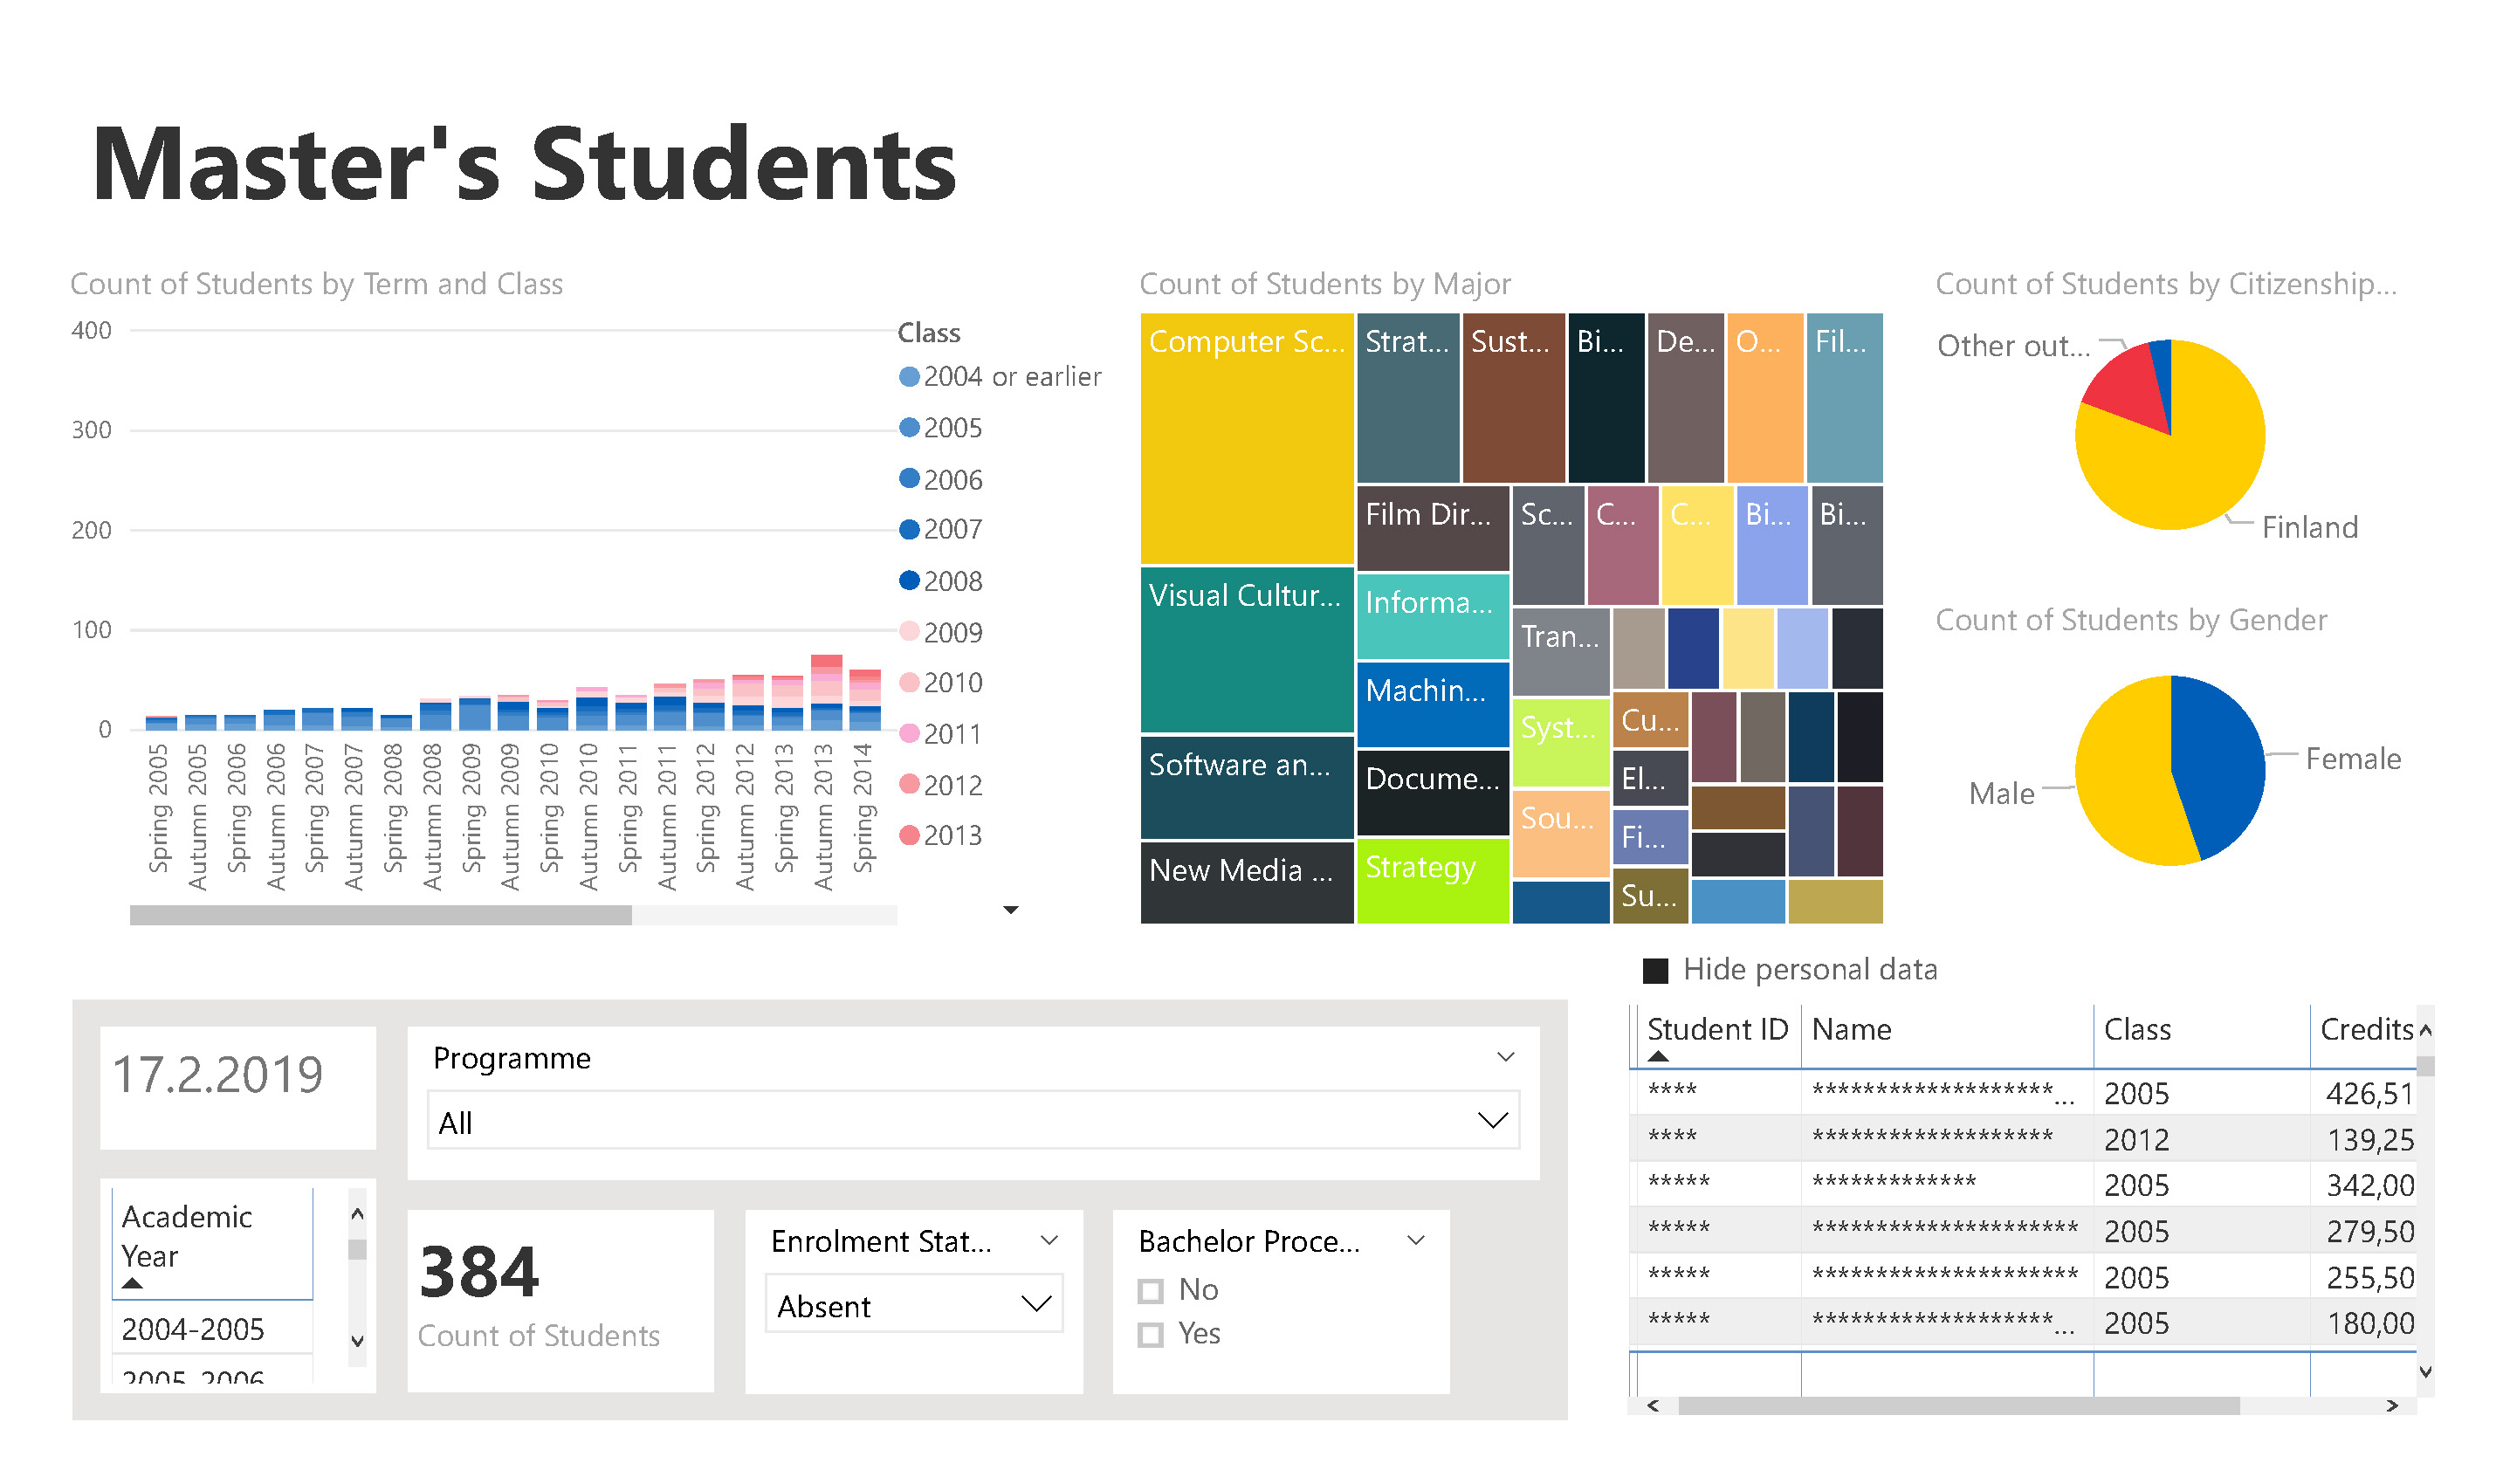
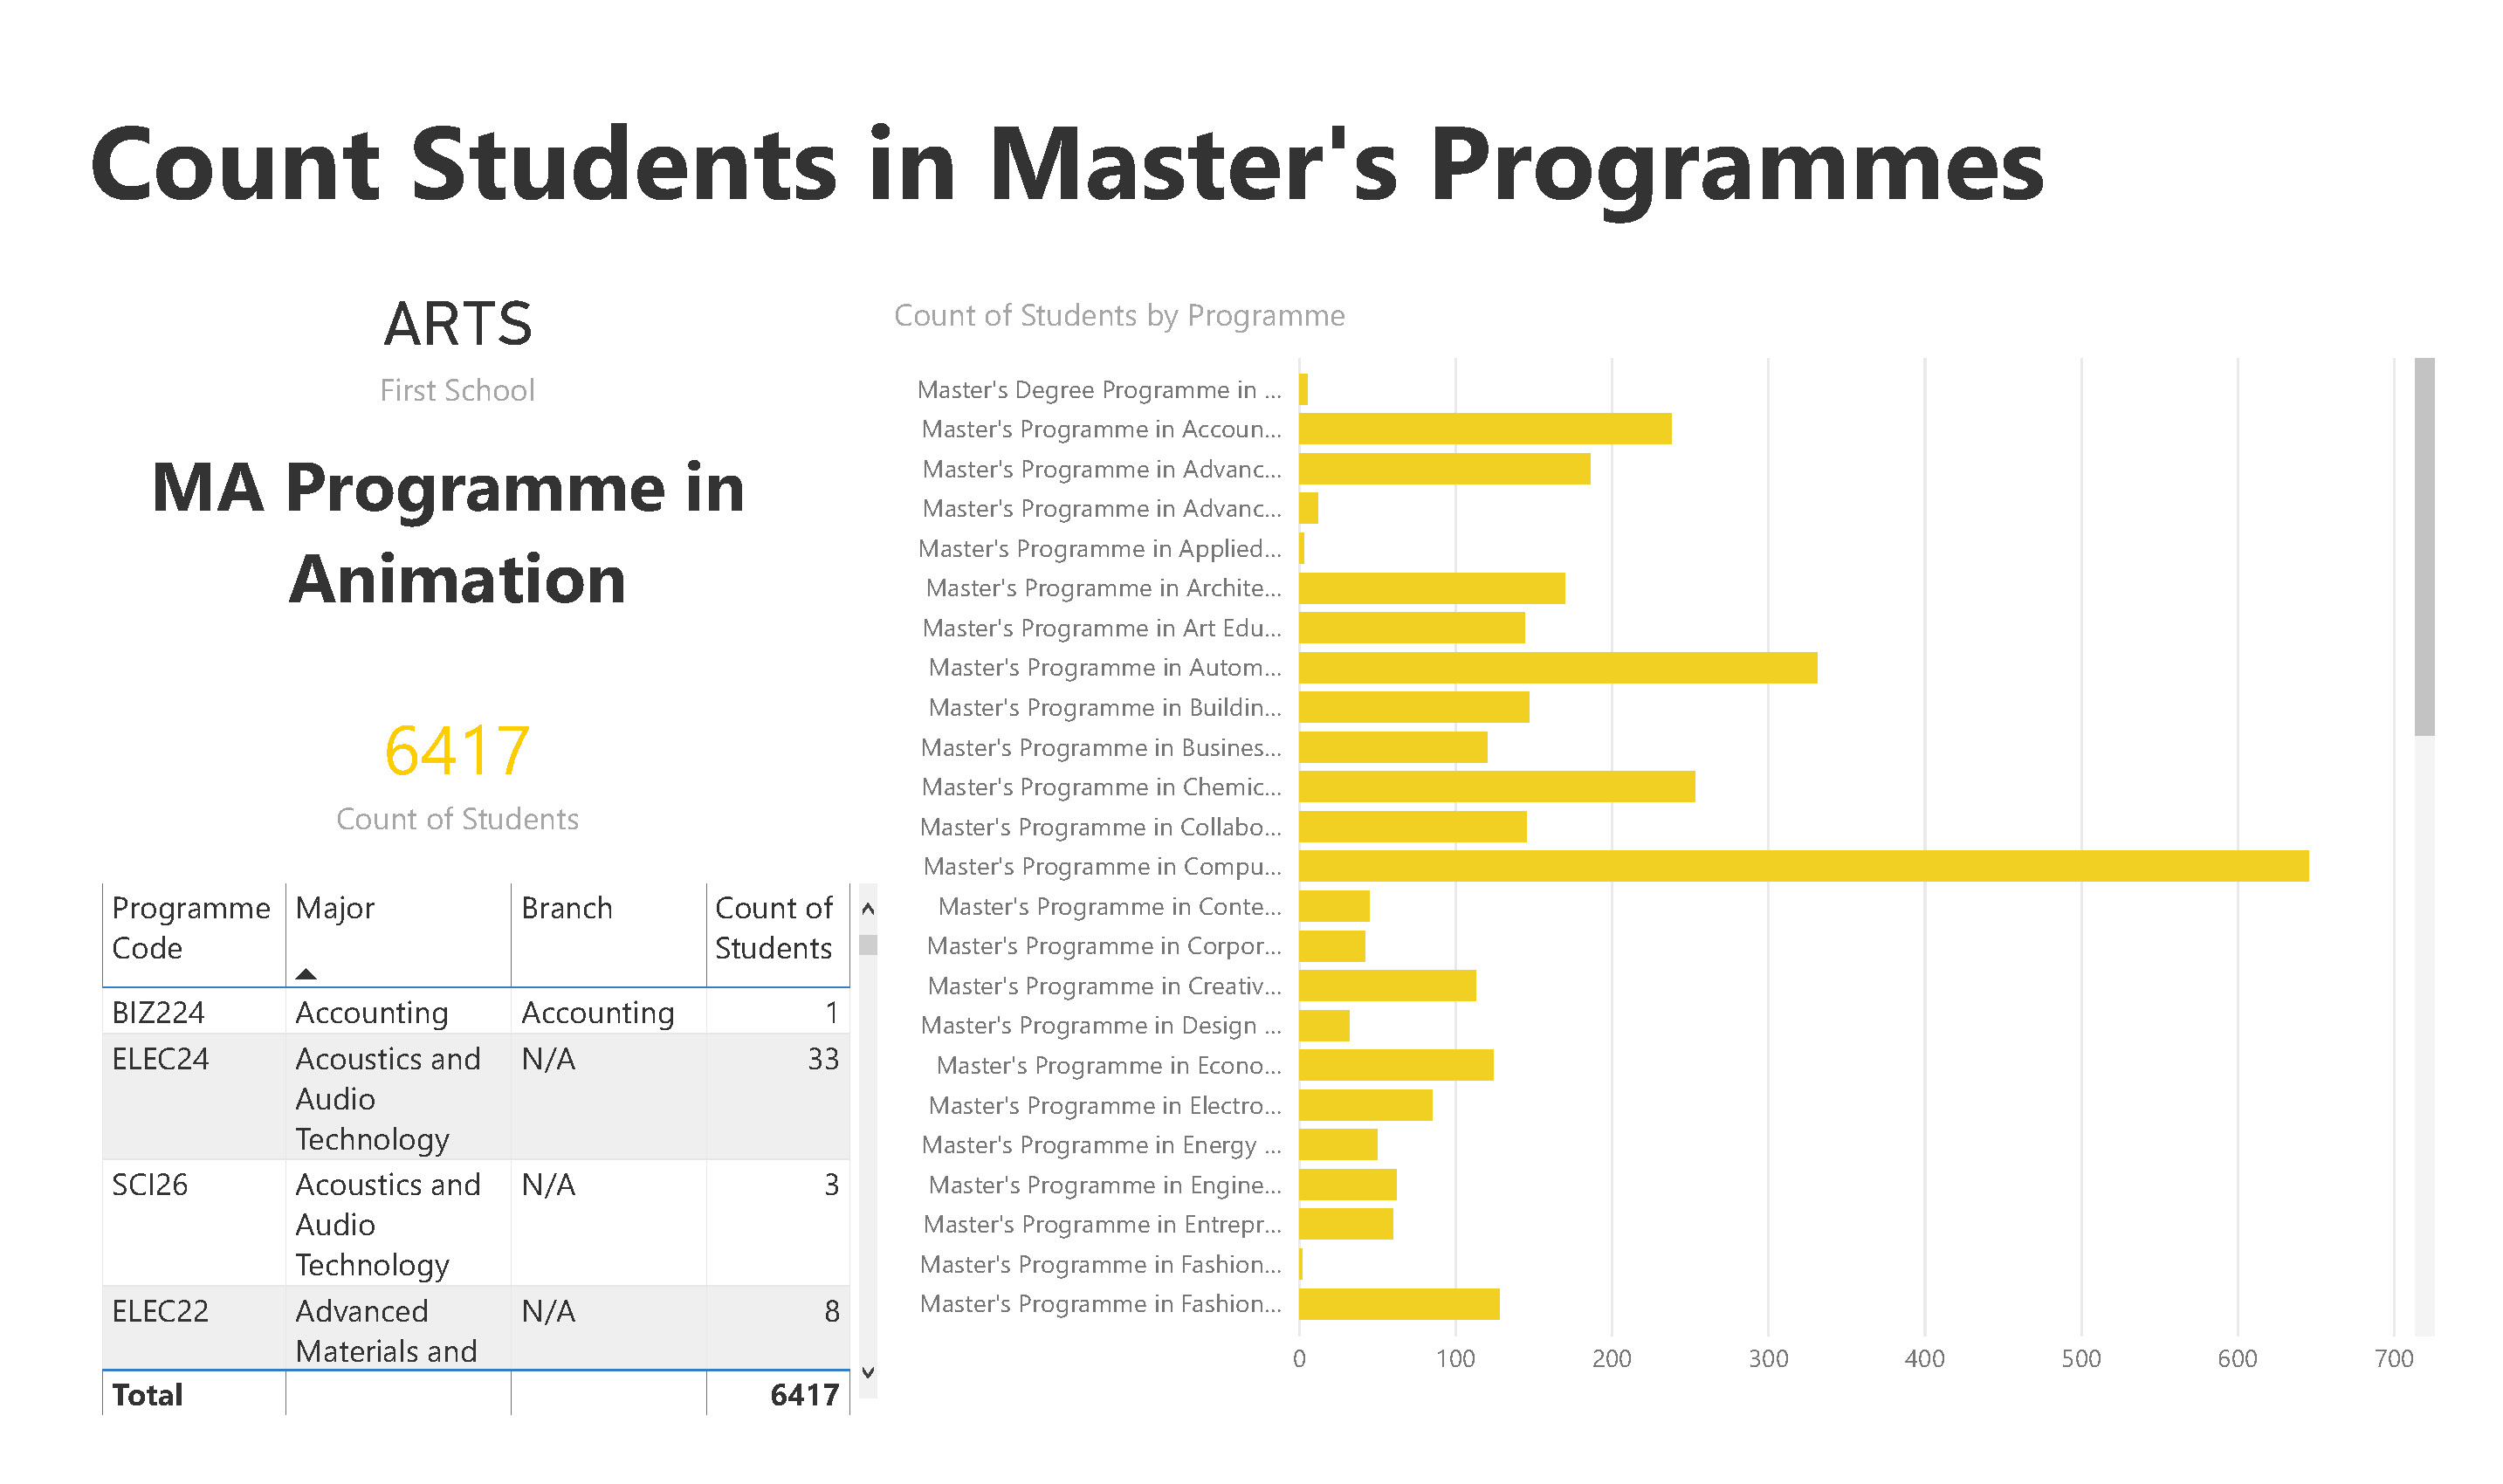
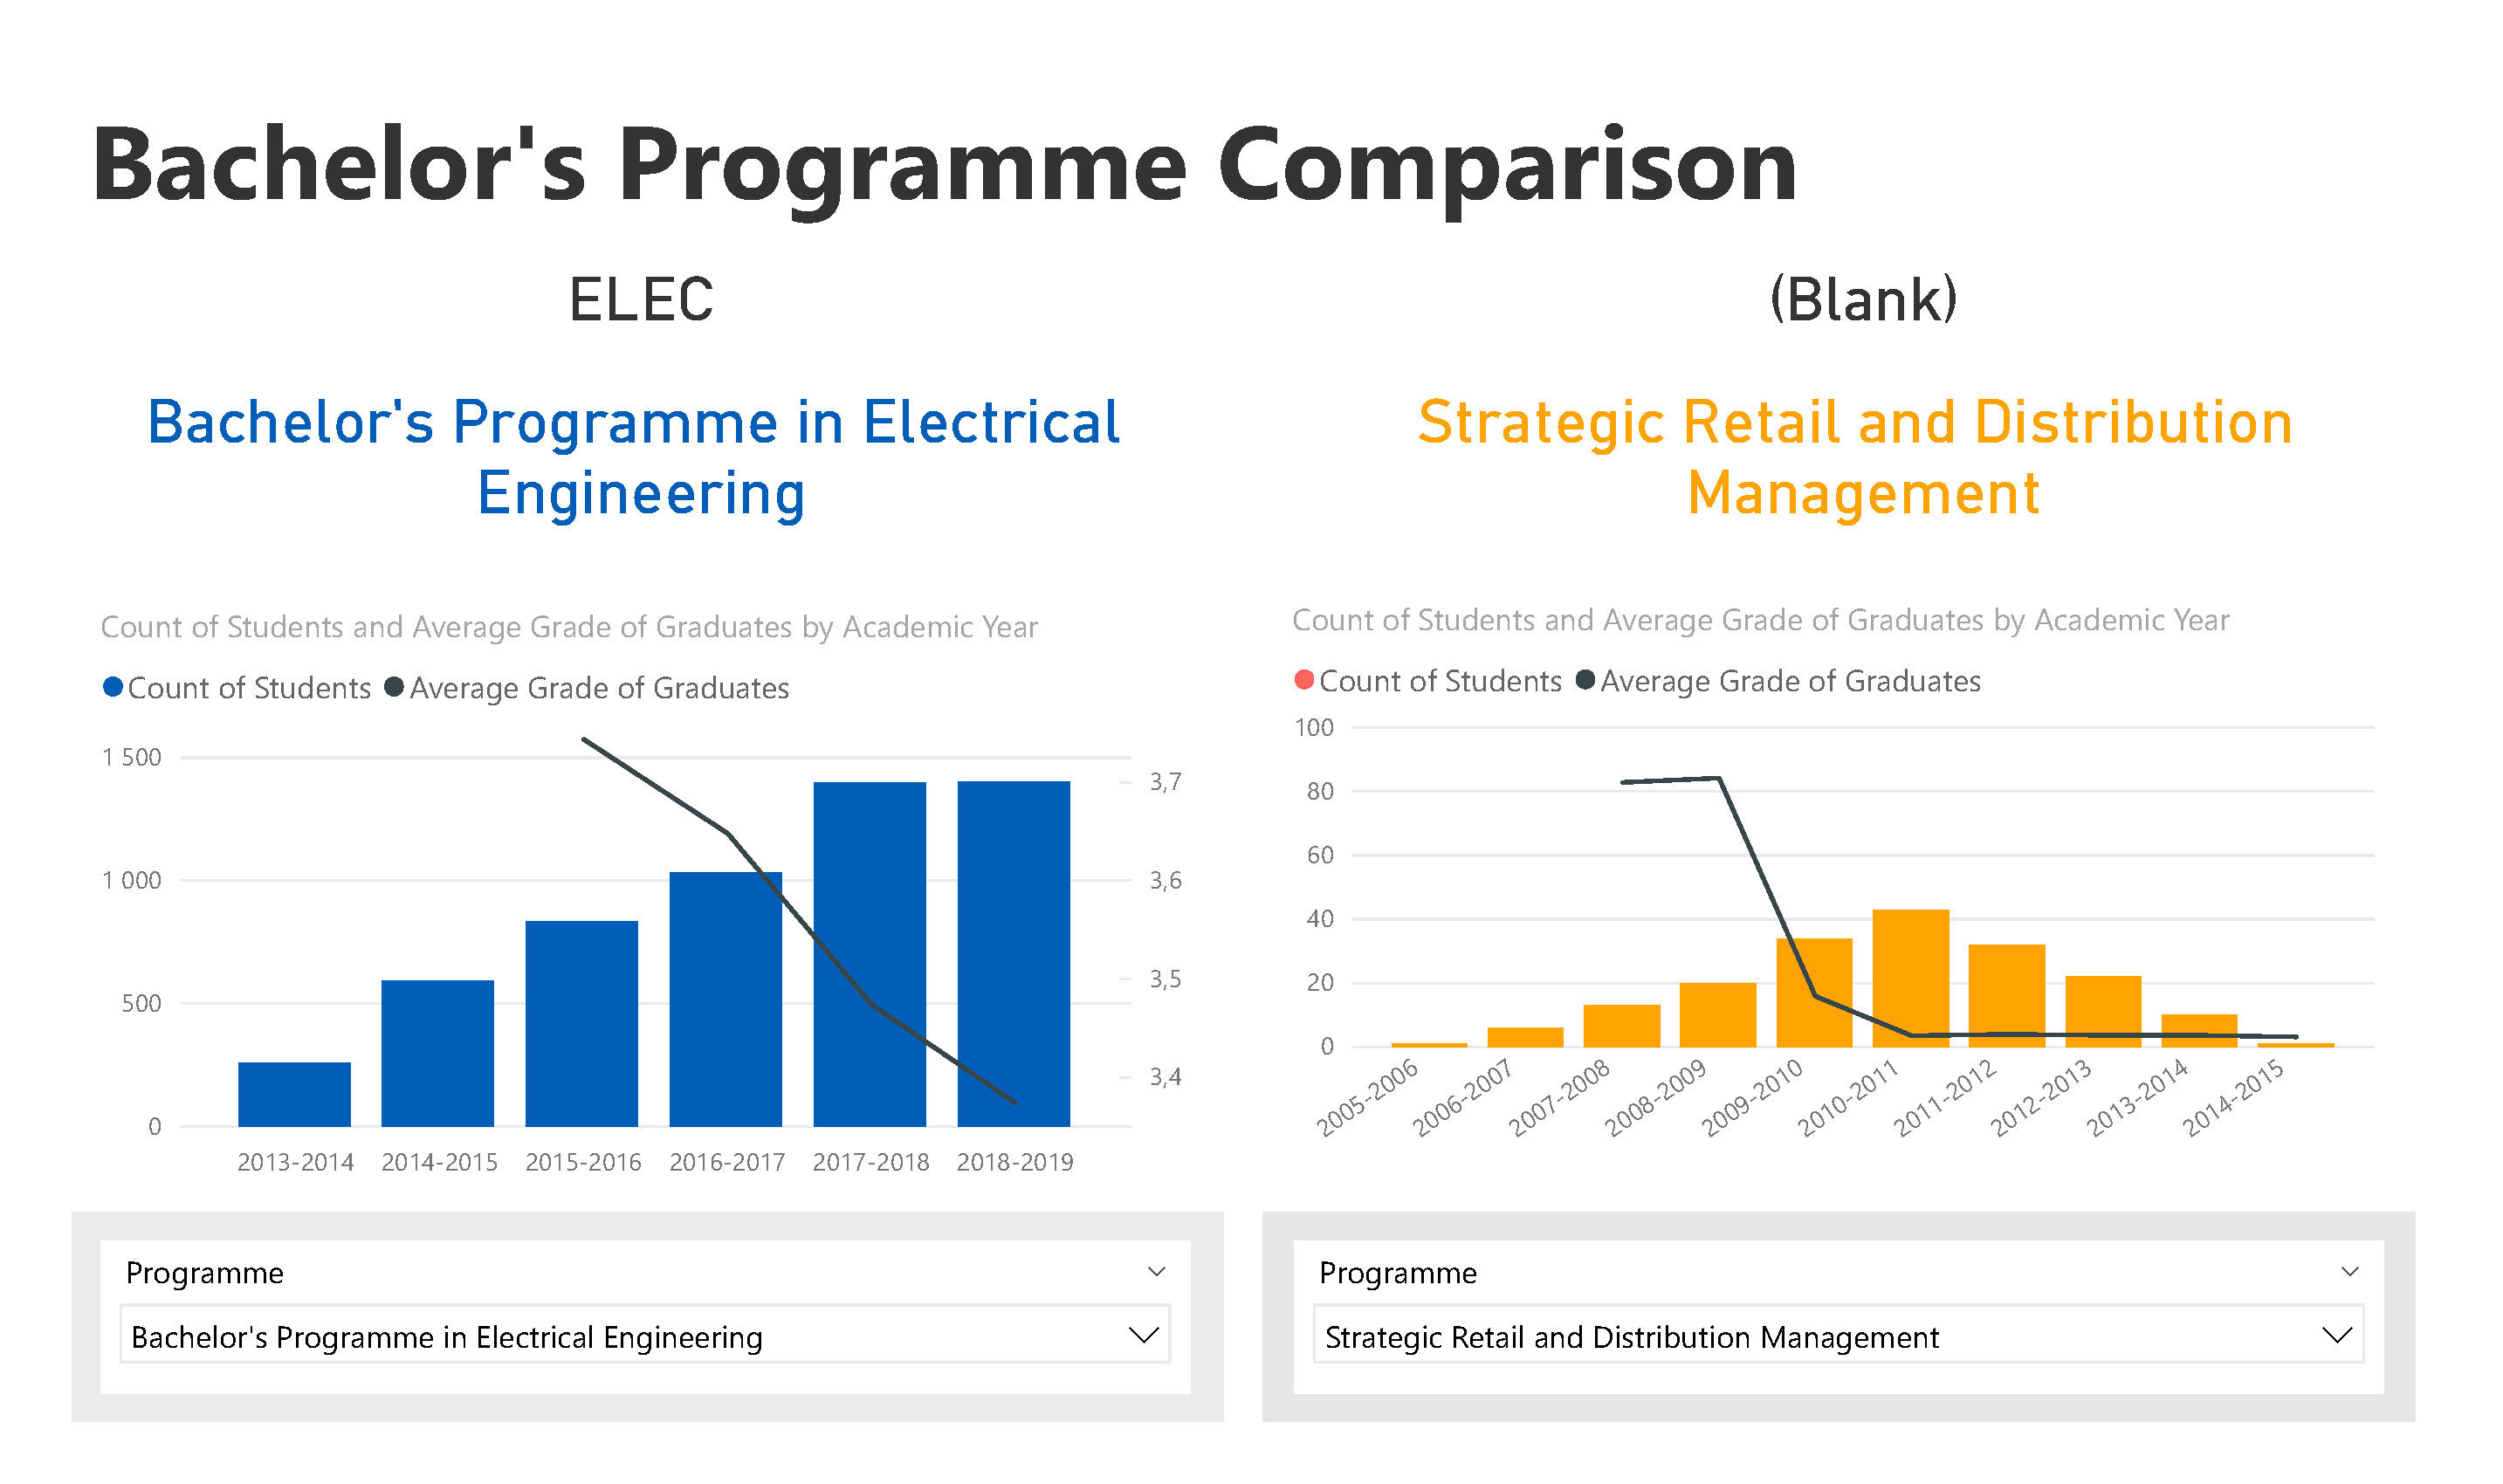
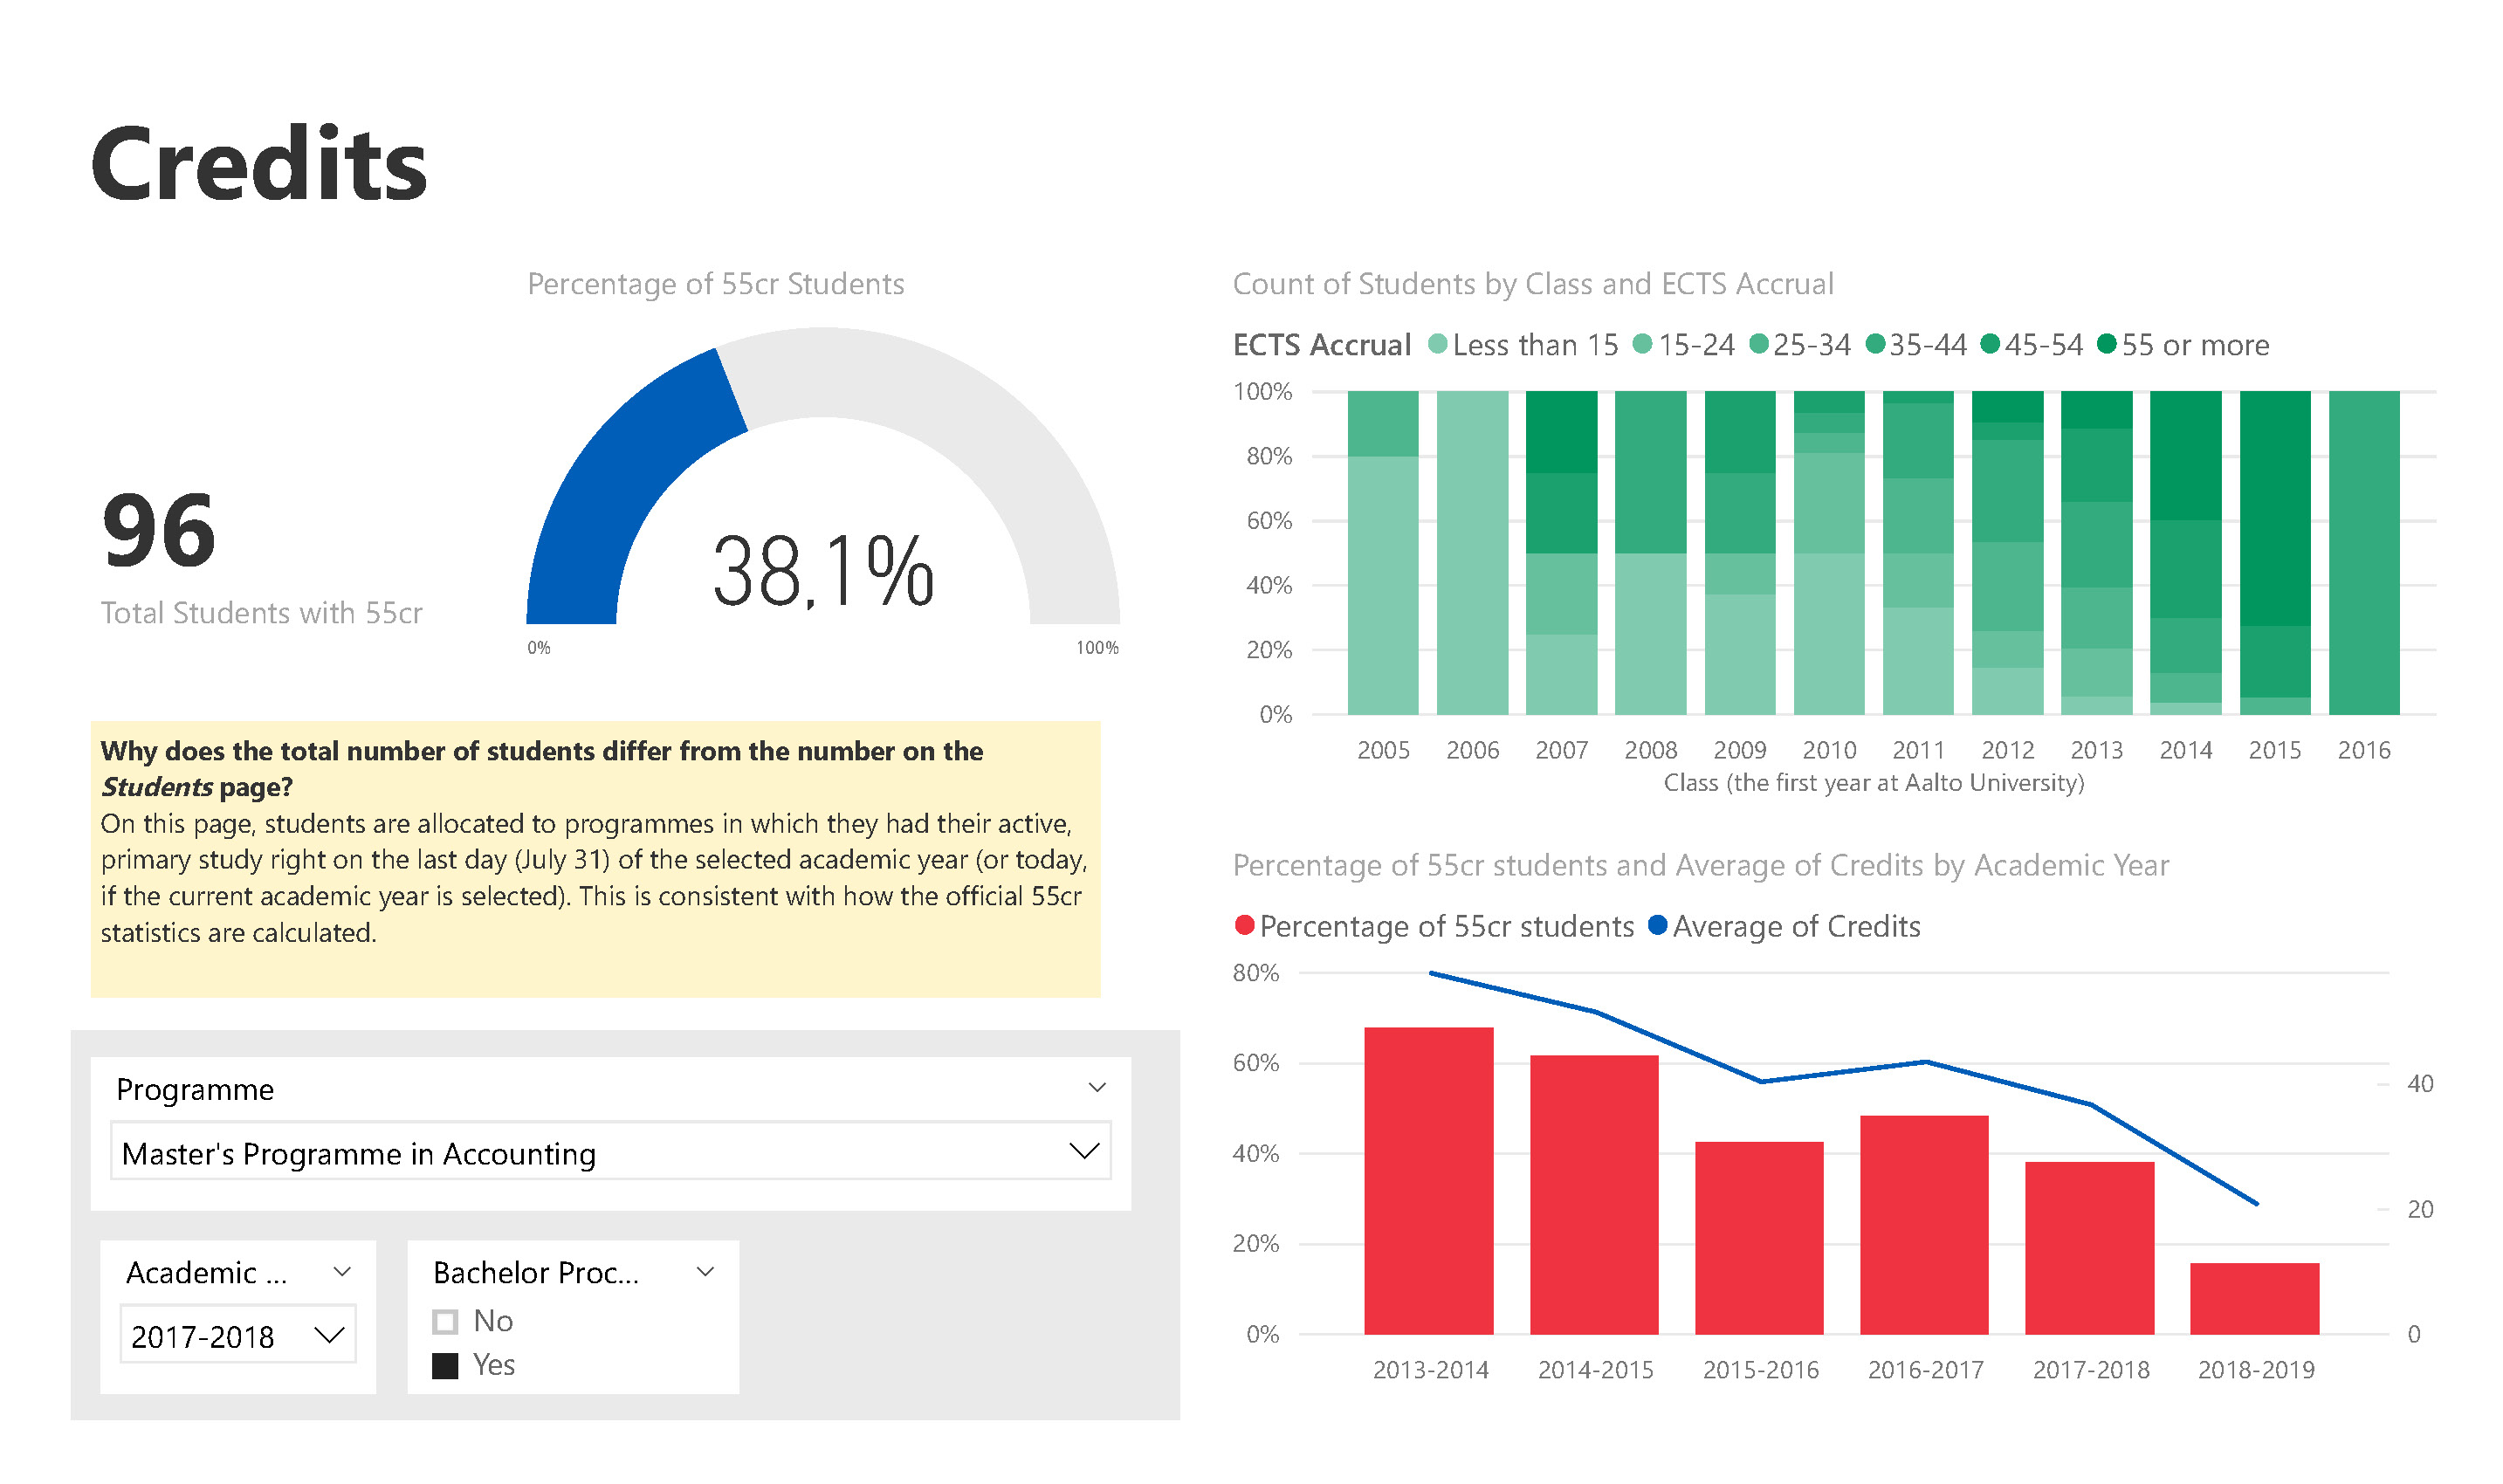
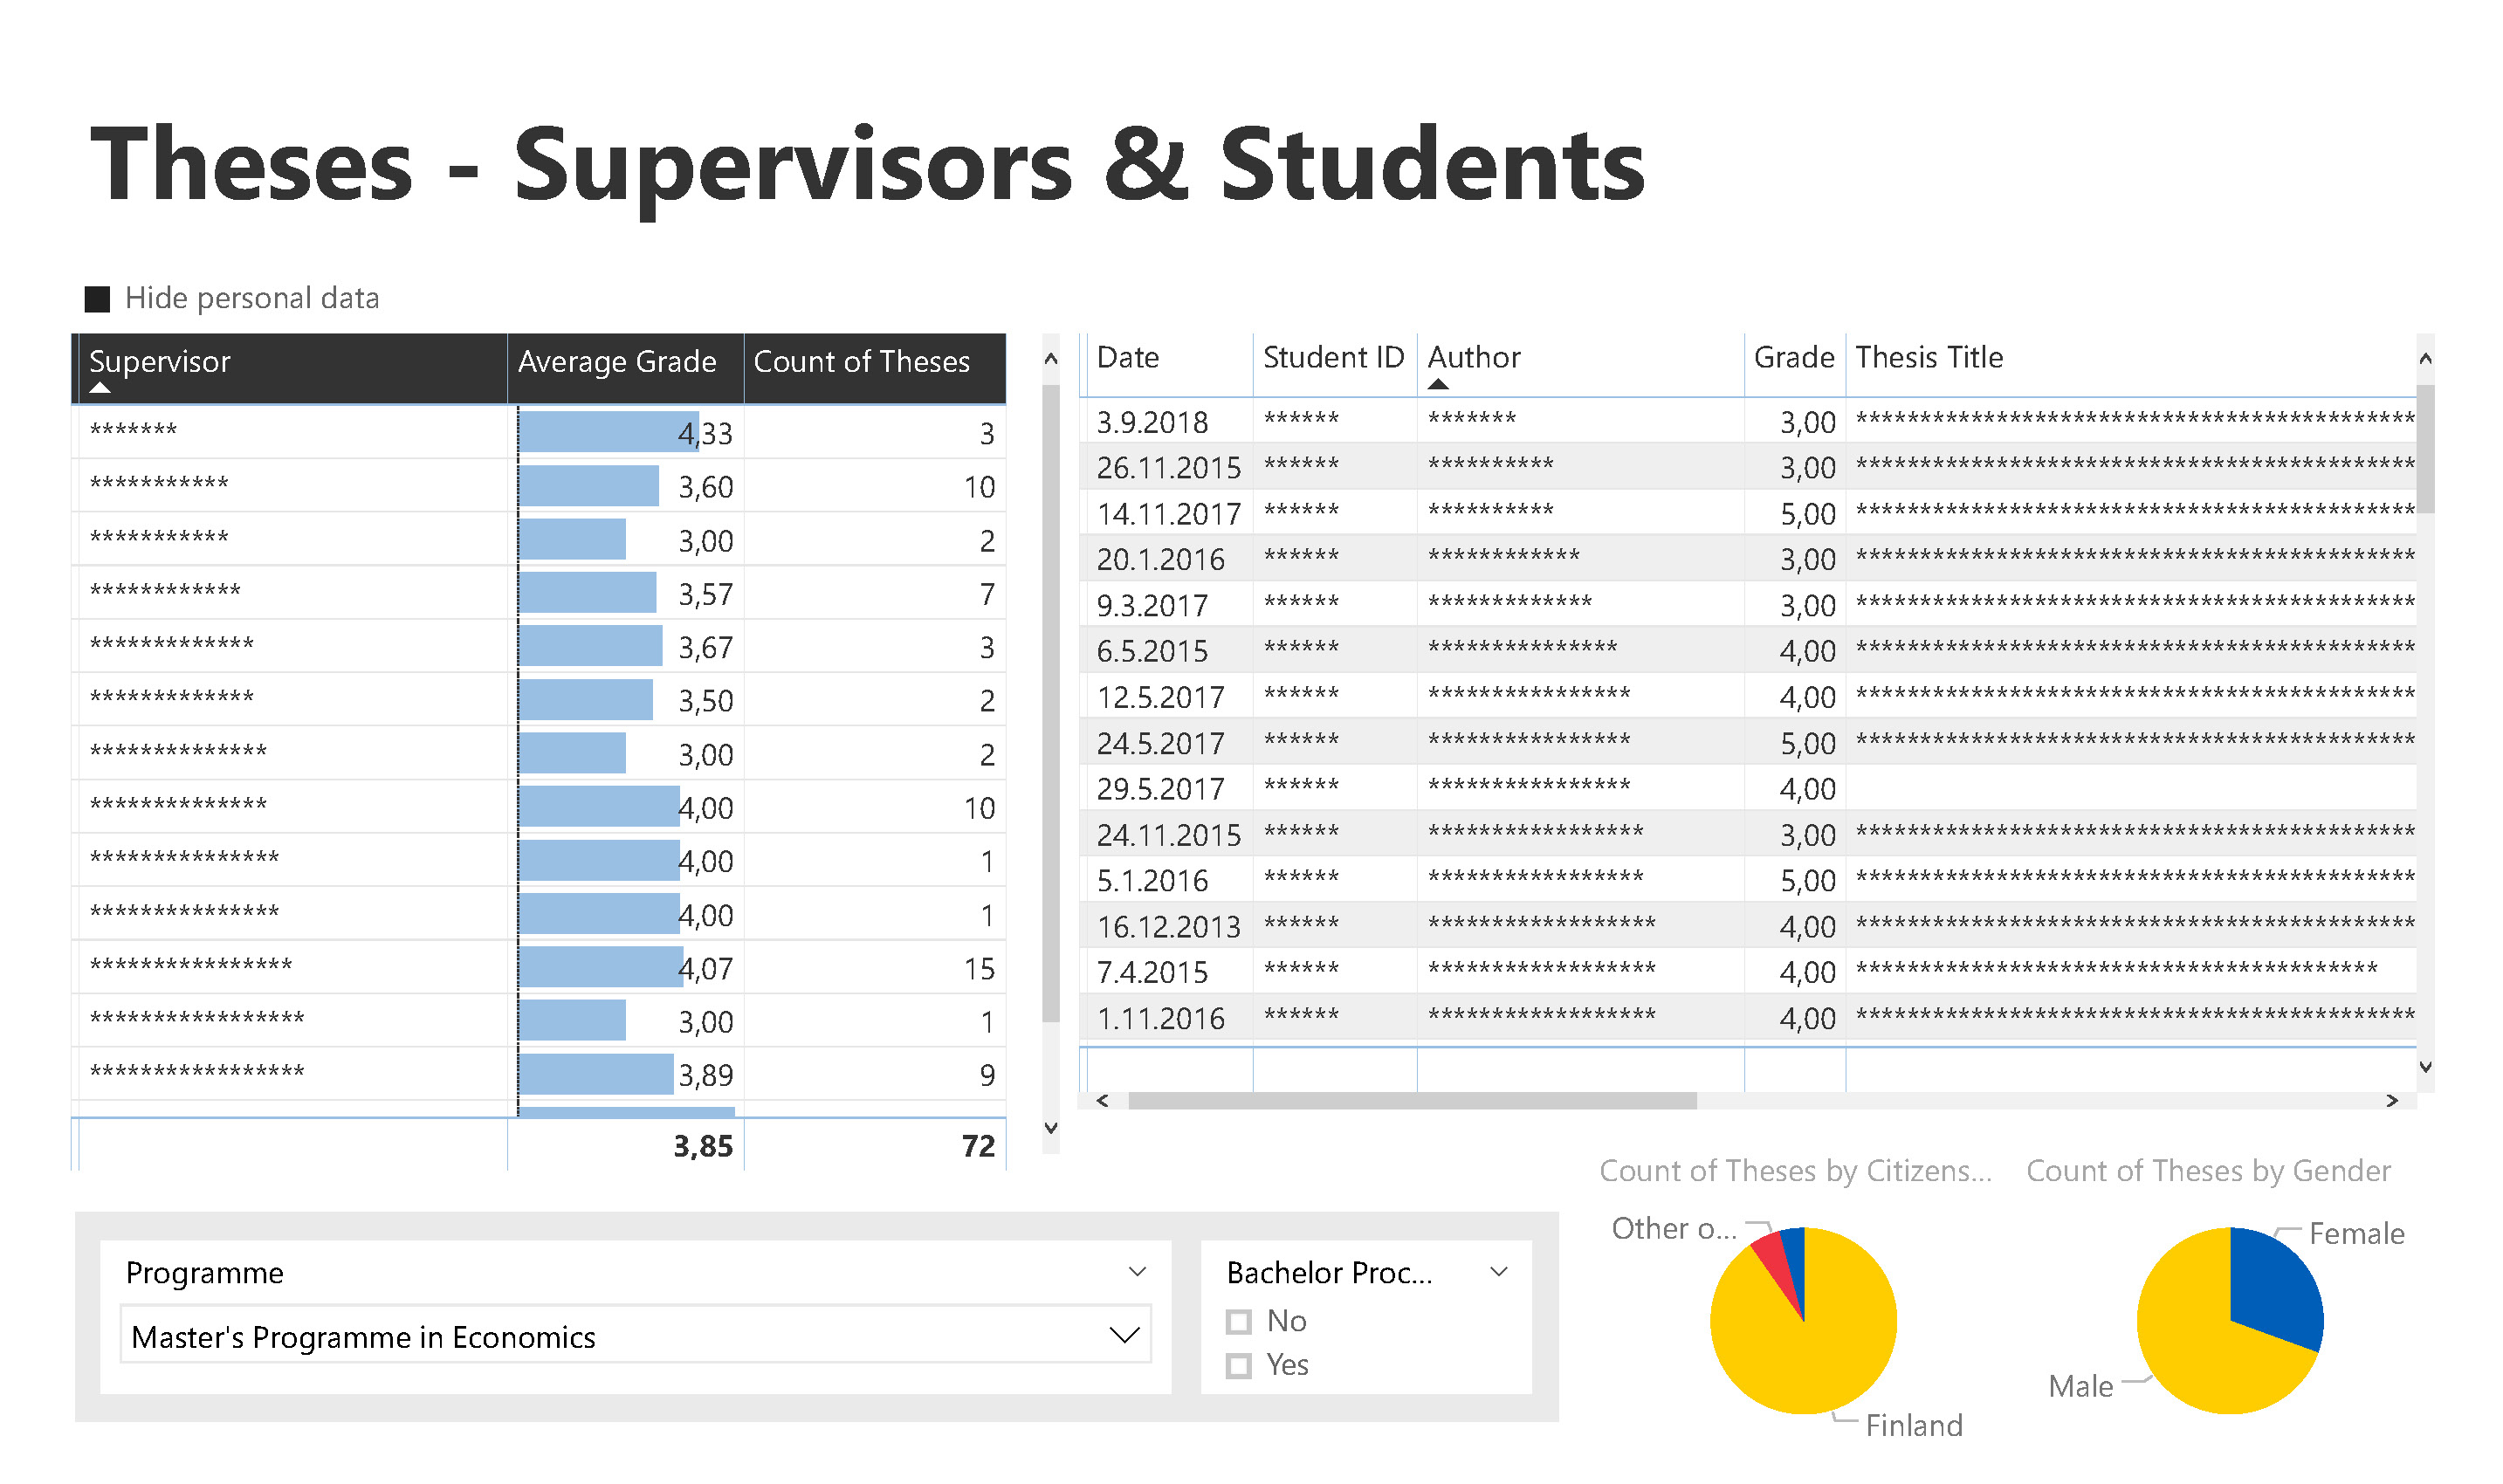
Dashboard visualizations for all programmes and schools at Aalto University using Microsoft’s Power BI software. Visualizations present student data for a variety of metrics, including nationality, grades, graduation rates, credits, and specializations. Data is comparable within and across all schools and programmes at the university.
Development of the dashboards included prototyping, user testing and interviewing, and guidelines for the tool’s maintenance.
Development of the dashboards included prototyping, user testing and interviewing, and guidelines for the tool’s maintenance.
Project type:
information design, UX/UI design
information design, UX/UI design